- Memecoin’s bulls had a slight edge over the bears, based on its indicators
- Liquidation heatmap highlighted the local highs as a short-term target
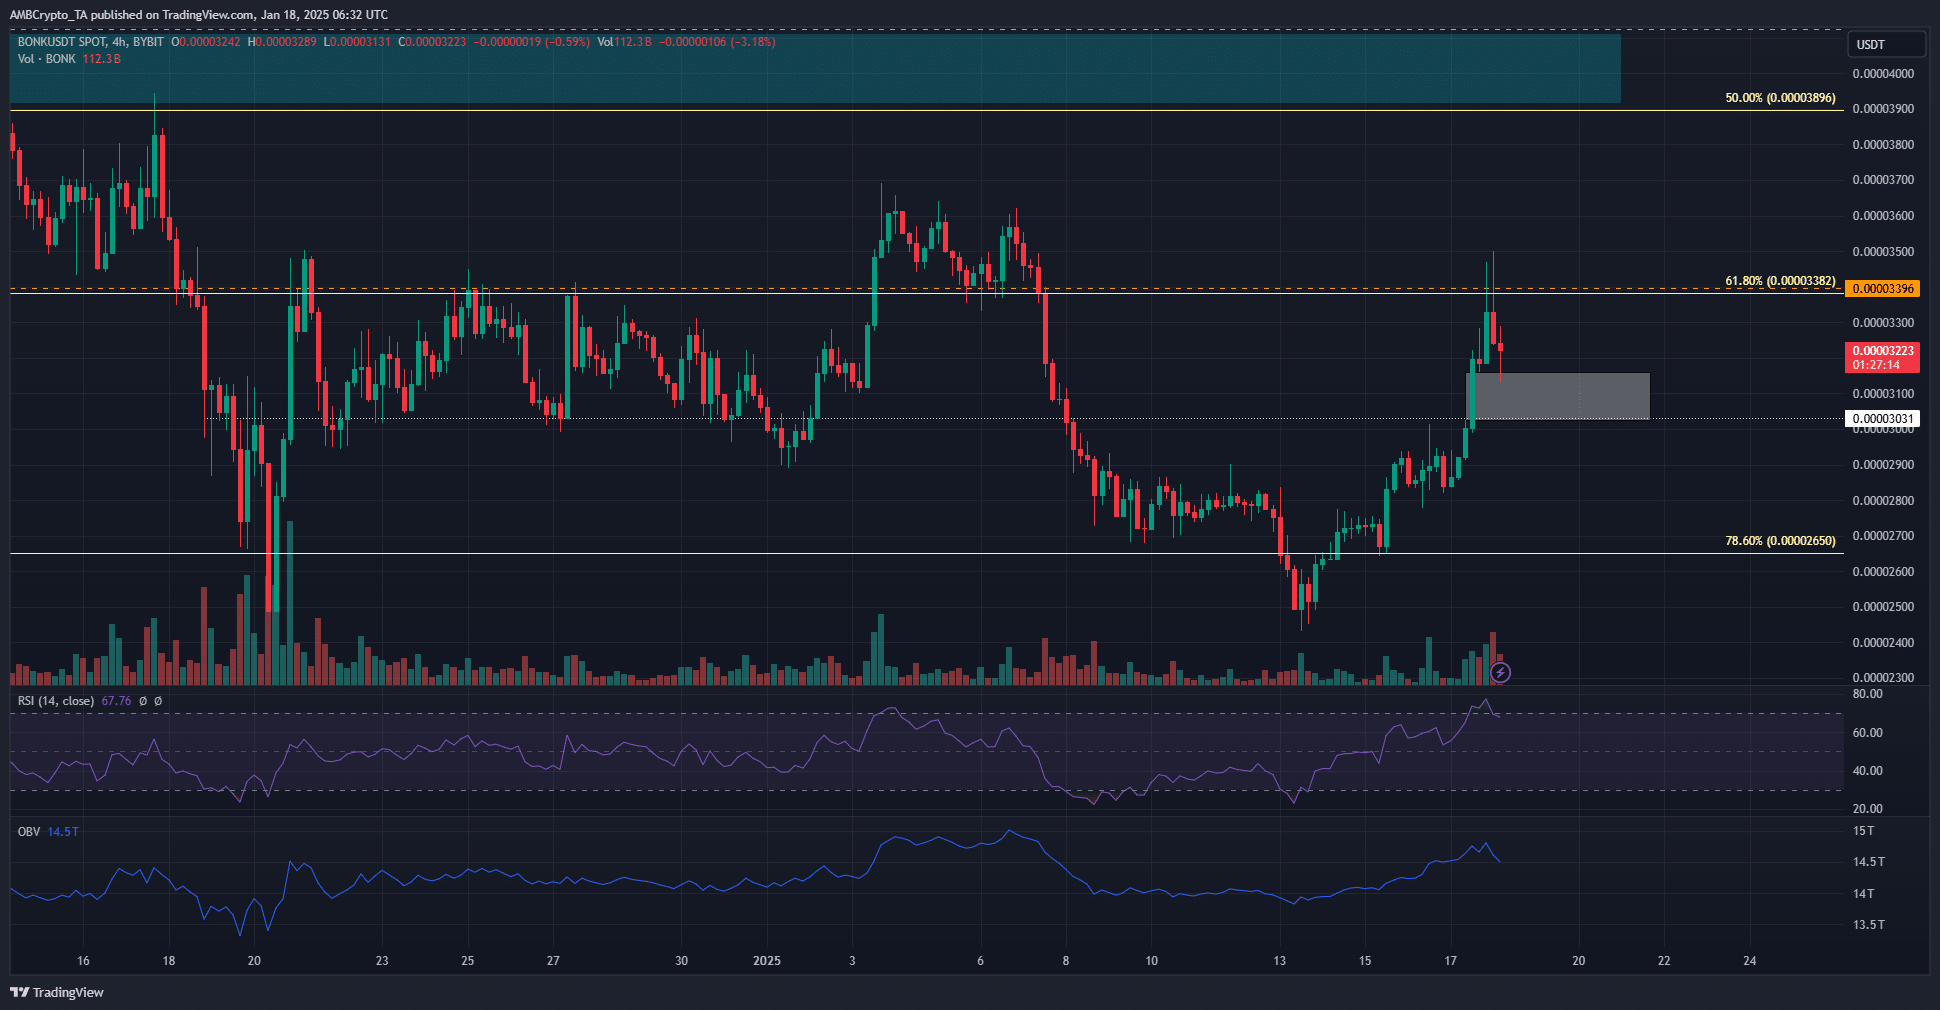
Bonk [BONK], at the time of writing, was on the verge of flipping the $0.0000338-level to support. However, in recent hours, the bulls faced some resistance at the 61.8% retracement level. In fact, the technical indicators revealed that the bulls had a slight advantage.
In light of Bitcoin’s [BTC] positive performance ahead of the U.S. presidential inauguration on 20 January, there may be some bullish hope for the memecoin. And yet, BONK traders must be wary of a failed breakout in case BTC’s momentum turns.
Time for another BONK rejection?
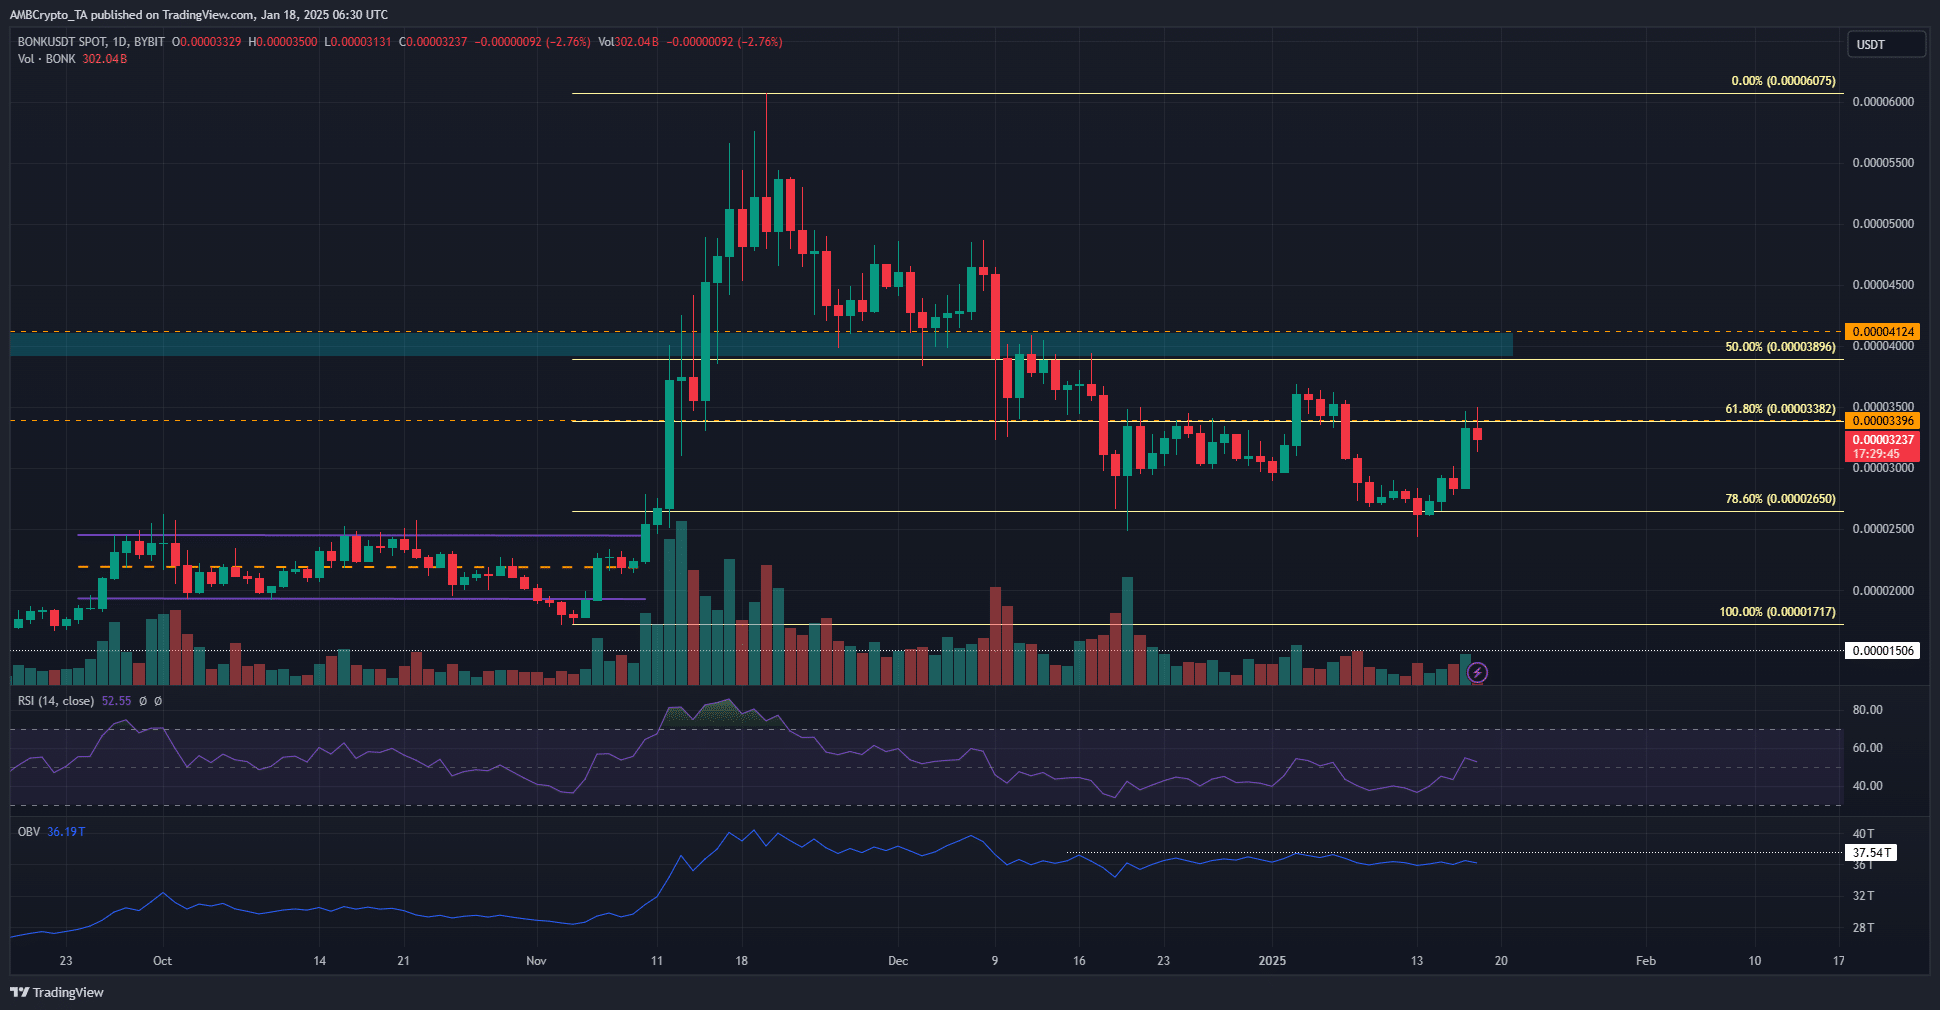
Source: BONK/USDT on TradingView
The daily chart exhibited a bearish structure after the price action exhibited a lower low last week. At press time, the price was trading just below the 61.8% Fibonacci retracement level at $0.0000338. The RSI poked its head above neutral 50 to indicate a shift in momentum in favor of the buyers.
The OBV has climbed higher over the past month, but was unable to breach a local high. This was another finding with a bullish tinge. Despite the memecoin sector’s losses over the last six weeks, BONK buyers had some strength left in them.