Disclaimer: The information presented does not constitute financial, investment, trading, or other types of advice and is solely the writer’s opinion.
- The market structure of Binance Coin remained bearish on the higher timeframe.
- The hopeful foray above $250 turned out to be a liquidity hunt.
Binance has faced a rough time in the market in recent weeks. The exchange faces pressure from regulatory authorities across different countries. As a consequence, its market share dropped to a one-year low.
Read Binance Coin’s [BNB] Price Prediction 2023-24
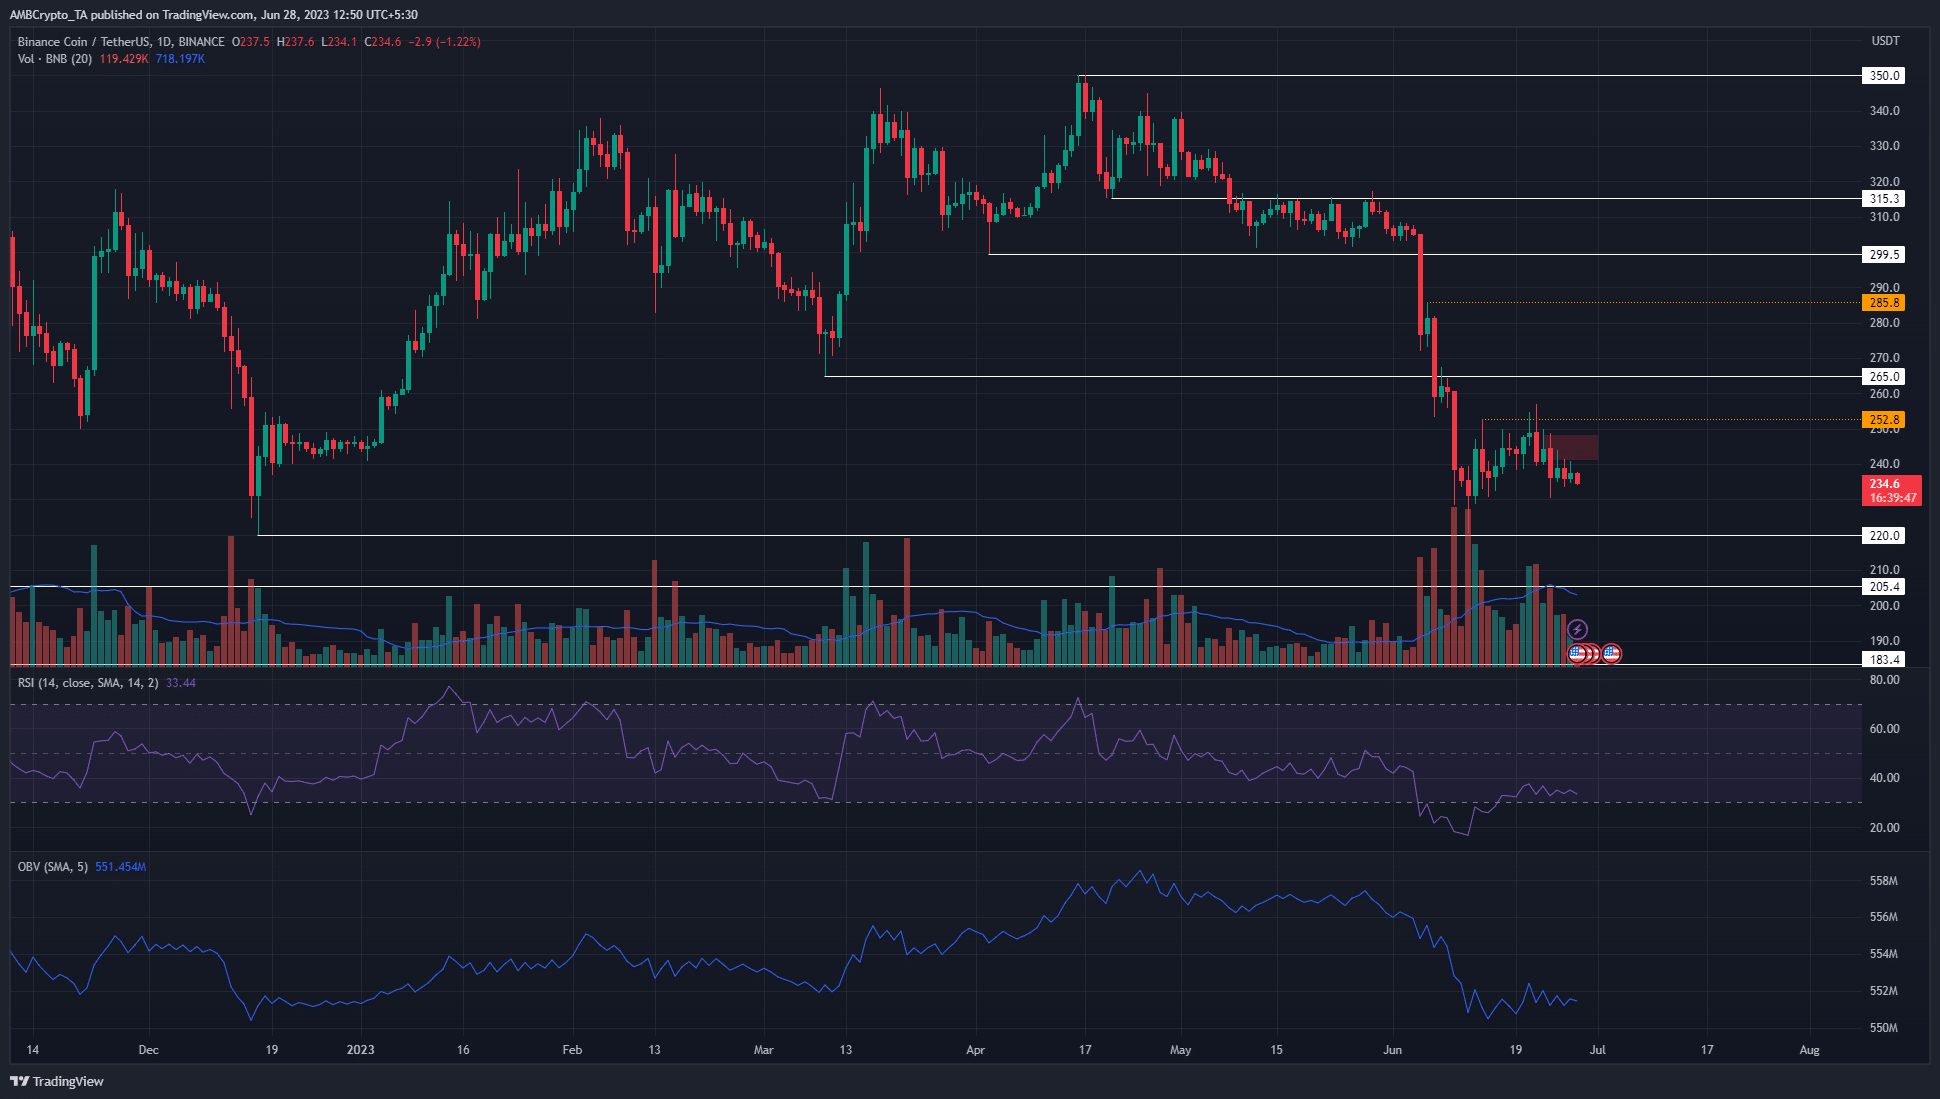
On the price chart, the exchange token Binance Coin [BNB] had a bearish outlook in the 1-day timeframe. It appeared likely that the token would drop further, toward $220 or lower in the coming weeks.
The bulls trap at $255 highlights the market sentiment
The 1-day chart showed a bearish structure that formed on 8 May, after the drop below $315.3. This level was a previous higher low. Binance Coin was stuck within a range formation in May. Thereafter, BNB formed a series of lower highs and lower lows on the market.
This trend continued in June. While the daily timeframe showed bearish momentum, the 4-hour chart showed signs of bullishness. Buyers had a brief victory when BNB prices pumped past $250, but could not defend the level.
Binance Coin dropped beneath $240 shortly after that. Meanwhile, the RSI on the 1-day chart remained well below neutral 50, showing strong bearish momentum. The OBV was fighting to climb higher but has not made significant headway in the past two weeks.
The weighted
Go to Source to See Full Article
Author: Akashnath S
Did you like this?
Tip BTC Newswire with Cryptocurrency
Donate Bitcoin to BTC Newswire
 Scan the QR code or copy the address below into your wallet to send some bitcoin:
Donate Bitcoin Cash to BTC Newswire
Scan the QR code or copy the address below into your wallet to send bitcoin:
Donate Ethereum to BTC Newswire
Scan the QR code or copy the address below into your wallet to send some Ether:
Donate Litecoin to BTC Newswire
Scan the QR code or copy the address below into your wallet to send some Litecoin:
Donate Monero to BTC Newswire
Scan the QR code or copy the address below into your wallet to send some Monero:
Donate ZCash to BTC Newswire
Scan the QR code or copy the address below into your wallet to send some ZCash:
Tip BTC Newswire with Cryptocurrency
Donate Bitcoin to BTC Newswire

Donate Bitcoin Cash to BTC Newswire

Donate Ethereum to BTC Newswire

Donate Litecoin to BTC Newswire

Donate Monero to BTC Newswire

Donate ZCash to BTC Newswire


