- The weekly time frame for Binance showed a key level to close above for a rally.
- The liquidation heatmap and profitability on BUSD signaled bullish momentum.
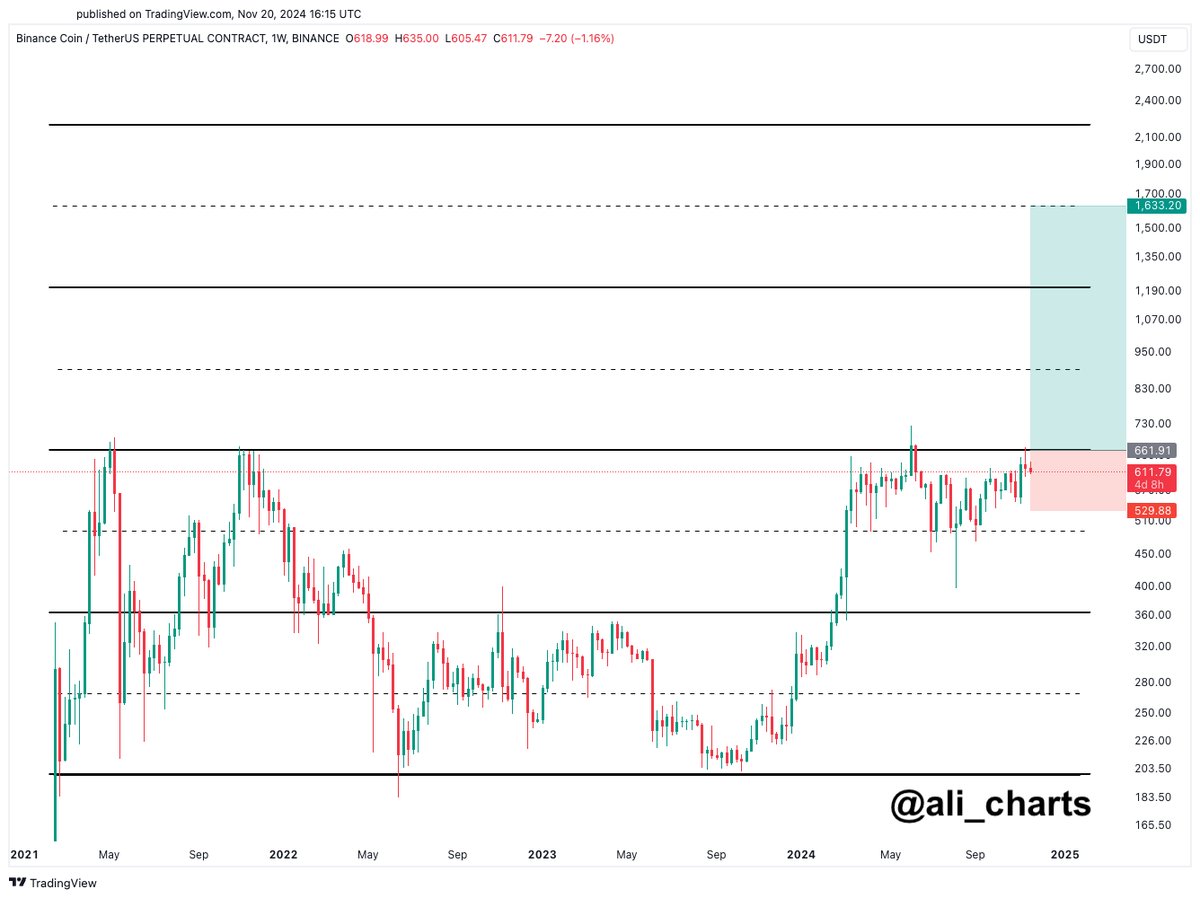
The weekly chart for Binance Coin [BNB] exhibited strong bullish momentum as it approached a critical resistance level.
BNB soared past multiple resistance levels and, settling in near the $662 mark at press time.
Analysts noted that a close above this level could open the way for a rally towards $1630, a target set by psychological expectations.
This potential move was indicated by the consistent higher lows BNB has been marking since early 2024, demonstrating a robust uptrend.
The recent volume spike further validated the strong buying interest at current price levels, suggesting a firm support base around $529.88.
Source: Ali/X
This support, coupled with the ascending trend, positioned BNB well for a continued uptrend. A secure weekly close above $662 could confirm the bullish scenario, potentially ushering an historic price rally.
The implications of such a move are substantial, marking a pivotal phase for Binance Coin in the competitive crypto market.
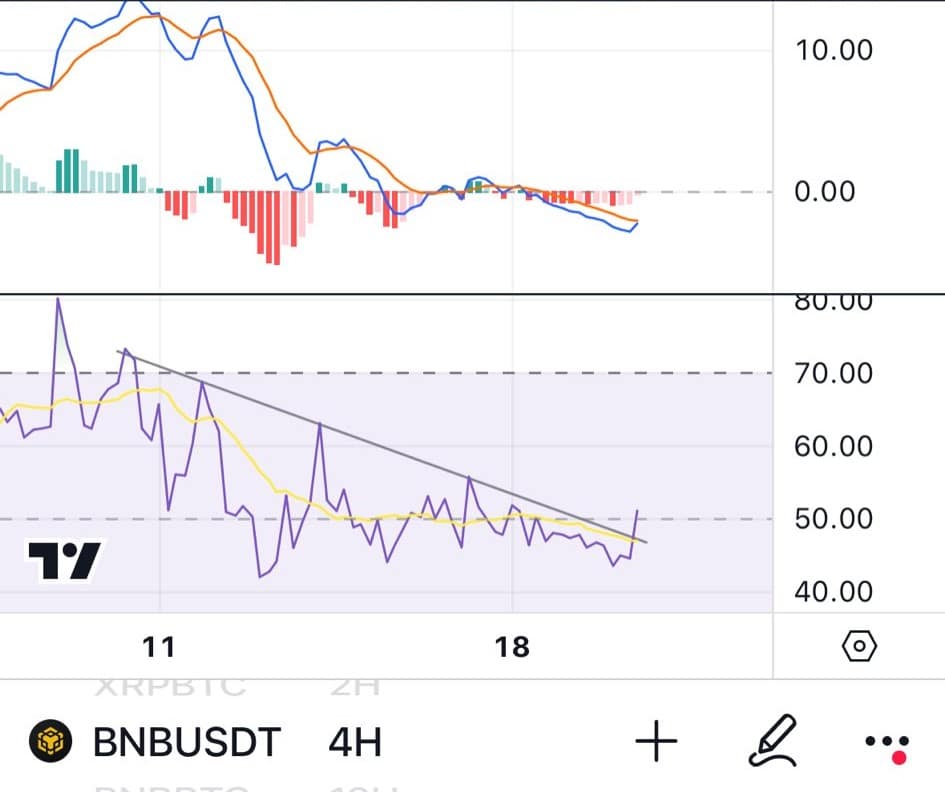
BNB’s RSI and MACD flipping bullish
The BNB on the 4-hour showed a positive shift as the Relative Strength Index (RSI) broke above its descending trendline, indicating renewed bullish momentum.
Alongside the RSI, the Moving Average Convergence Divergence (MACD) has also turned bullish, highlighting an increase in buying pressure.