Key Takeaways
Why are traders watching Bitcoin’s Smart Model?
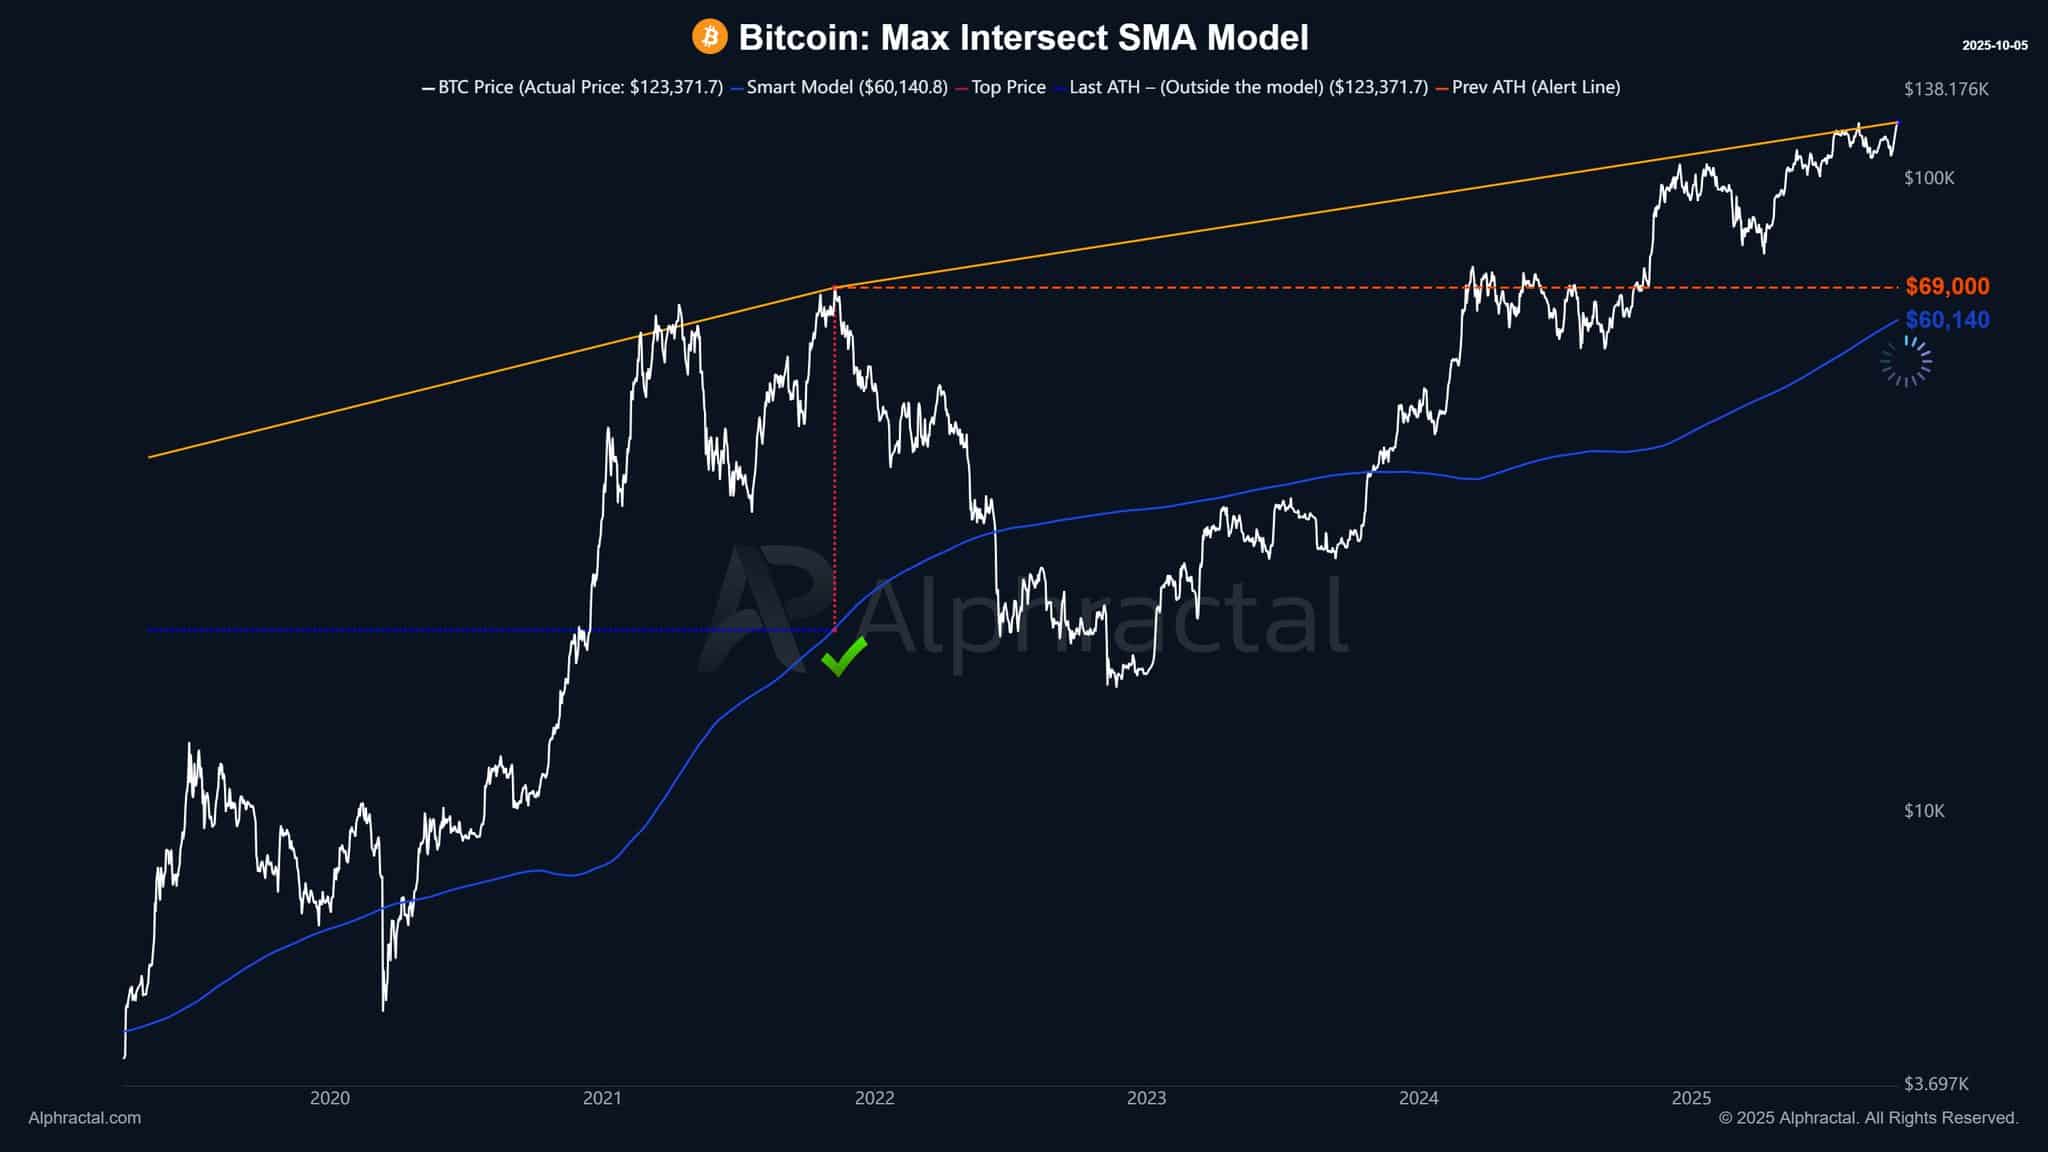
It just crossed $60K, historically signaling Bitcoin’s approach to a cycle top near $69K.
What does on-chain data reveal?
Futures Taker CVD shows bearish dominance, while UTXOs in Loss suggest rising profit-taking pressure.
Bitcoin [BTC] witnessed a major price catalyst this week, climbing to a new all-time high as institutional inflows surged to $3.2 billion over the past week.
Despite strong momentum, BTC held near $123,000 at press time. The price action leaves room for a potential correction, much like the previous pullback after crossing $124,000.
This cautious outlook appears justified, as AMBCrypto’s analysis shows that certain investor activities are beginning to align with expectations of a possible market decline.
‘Max Model’ warns of a near-term peak
The Max Intersect SMA Model, often used to identify Bitcoin’s market-cycle peaks, indicated that bearish momentum could soon emerge.
According to Alphafractal data, the Smart Model (blue line) crossed $60,140, its highest reading of this cycle.
Joao Wedson, founder of Alphafractal, noted on X that once this metric touches $69,000, it typically flashes a sell signal marking a cycle top.
This alignment historically preceded major tops in 2017 and 2021. The model currently projects the theoretical price ceiling near $138,000, with BTC already testing the $123,000–$125,000 zone.
Amid these developments, AMBCrypto’s analysis found that traders appear to be rotating toward defensive positioning despite ongoing inflows.