- The ETH/BTC chart has been in a long-term downtrend.
- In comparison, the strength of Bitcoin was clear and is likely to continue.
Since October, Bitcoin [BTC] has rallied by an impressive 57.5% as of press time. In the same period, Ethereum [ETH] gains measured 48.34%. The difference is not much, but ETH has been underperforming for close to a year now.
This means that during times when Bitcoin runs higher, Ethereum doesn’t achieve equivalent or higher gains. During periods of a downturn, Ethereum prices suffer more than Bitcoin’s.
Is this trend likely to reverse?
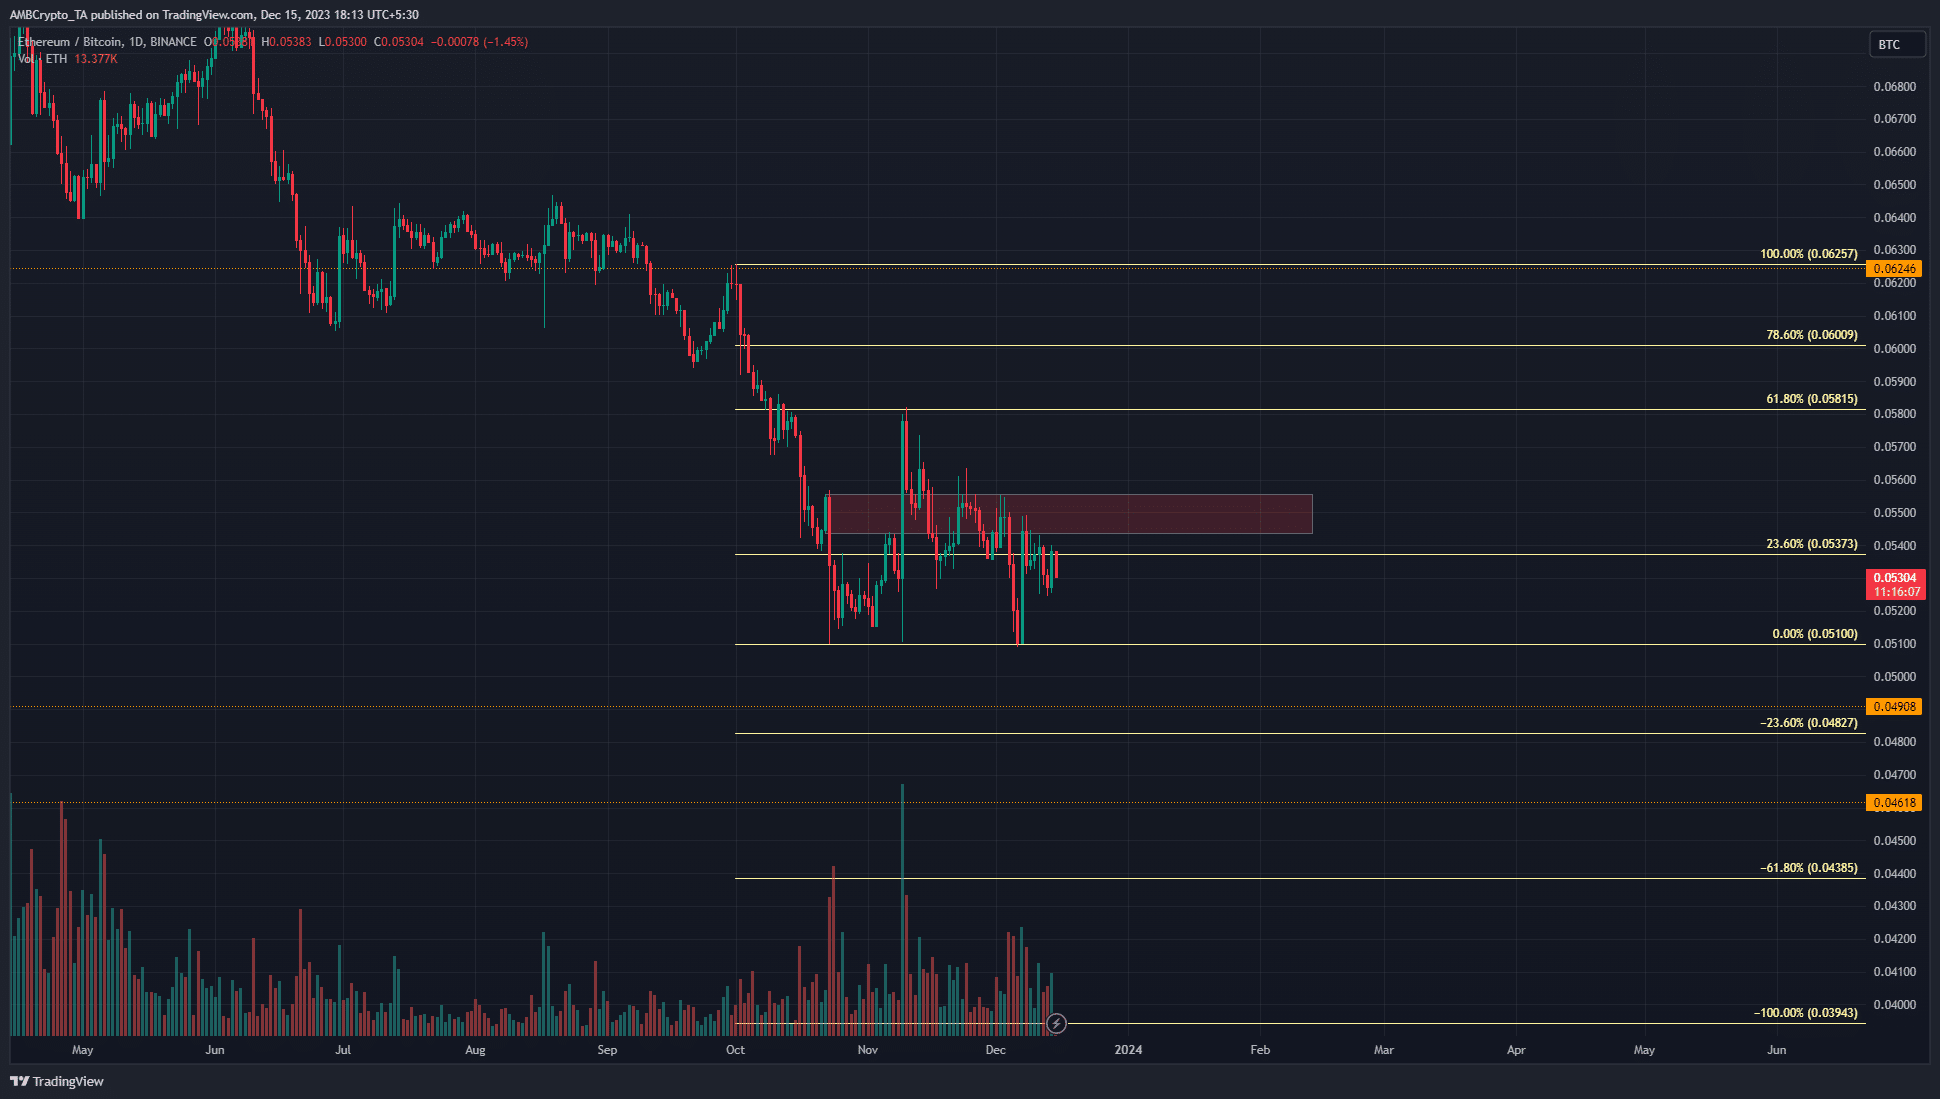
Technical analysis of the ETH/BTC chart underlined gloom
The ETH/BTC chart on the one-day timeframe highlighted the downtrend that has been present since early June. The inference was that ETH just wasn’t able to keep up in terms of performance. And the story doesn’t end there.
The zone of resistance highlighted at the 0.055 region represented a key resistance zone that ETH bulls will need to breach to reverse their fortunes. However, the market structure was bearish.
The 61.8% Fibonacci retracement level was tested on 10th November. It was followed by a rapid reversal.
A move below the 0.051 mark would signal that ETH/BTC was headed much further lower. If that happens, traders and investors could exit the ETH market if a higher timeframe bearish market structure break occurs.
Assuming Bitcoin climbs above the $45k key resistance but ETH/BTC falls, participants could look to shift their funds to BTC to ride the trend higher.
Assessing sell pressure on ETH and BTC
A sign that sell pressure is imminent on an asset is if we spot large inflows to exchanges. If that happens, the exchange reserve for the asset would shoot skyward. In the case of both Bitcoin and Ethereum, this has not yet occurred.
The BTC exchange reserve has co
Go to Source to See Full Article
Author: Akashnath S
Tip BTC Newswire with Cryptocurrency
Donate Bitcoin to BTC Newswire

Donate Bitcoin Cash to BTC Newswire

Donate Ethereum to BTC Newswire

Donate Litecoin to BTC Newswire

Donate Monero to BTC Newswire

Donate ZCash to BTC Newswire


