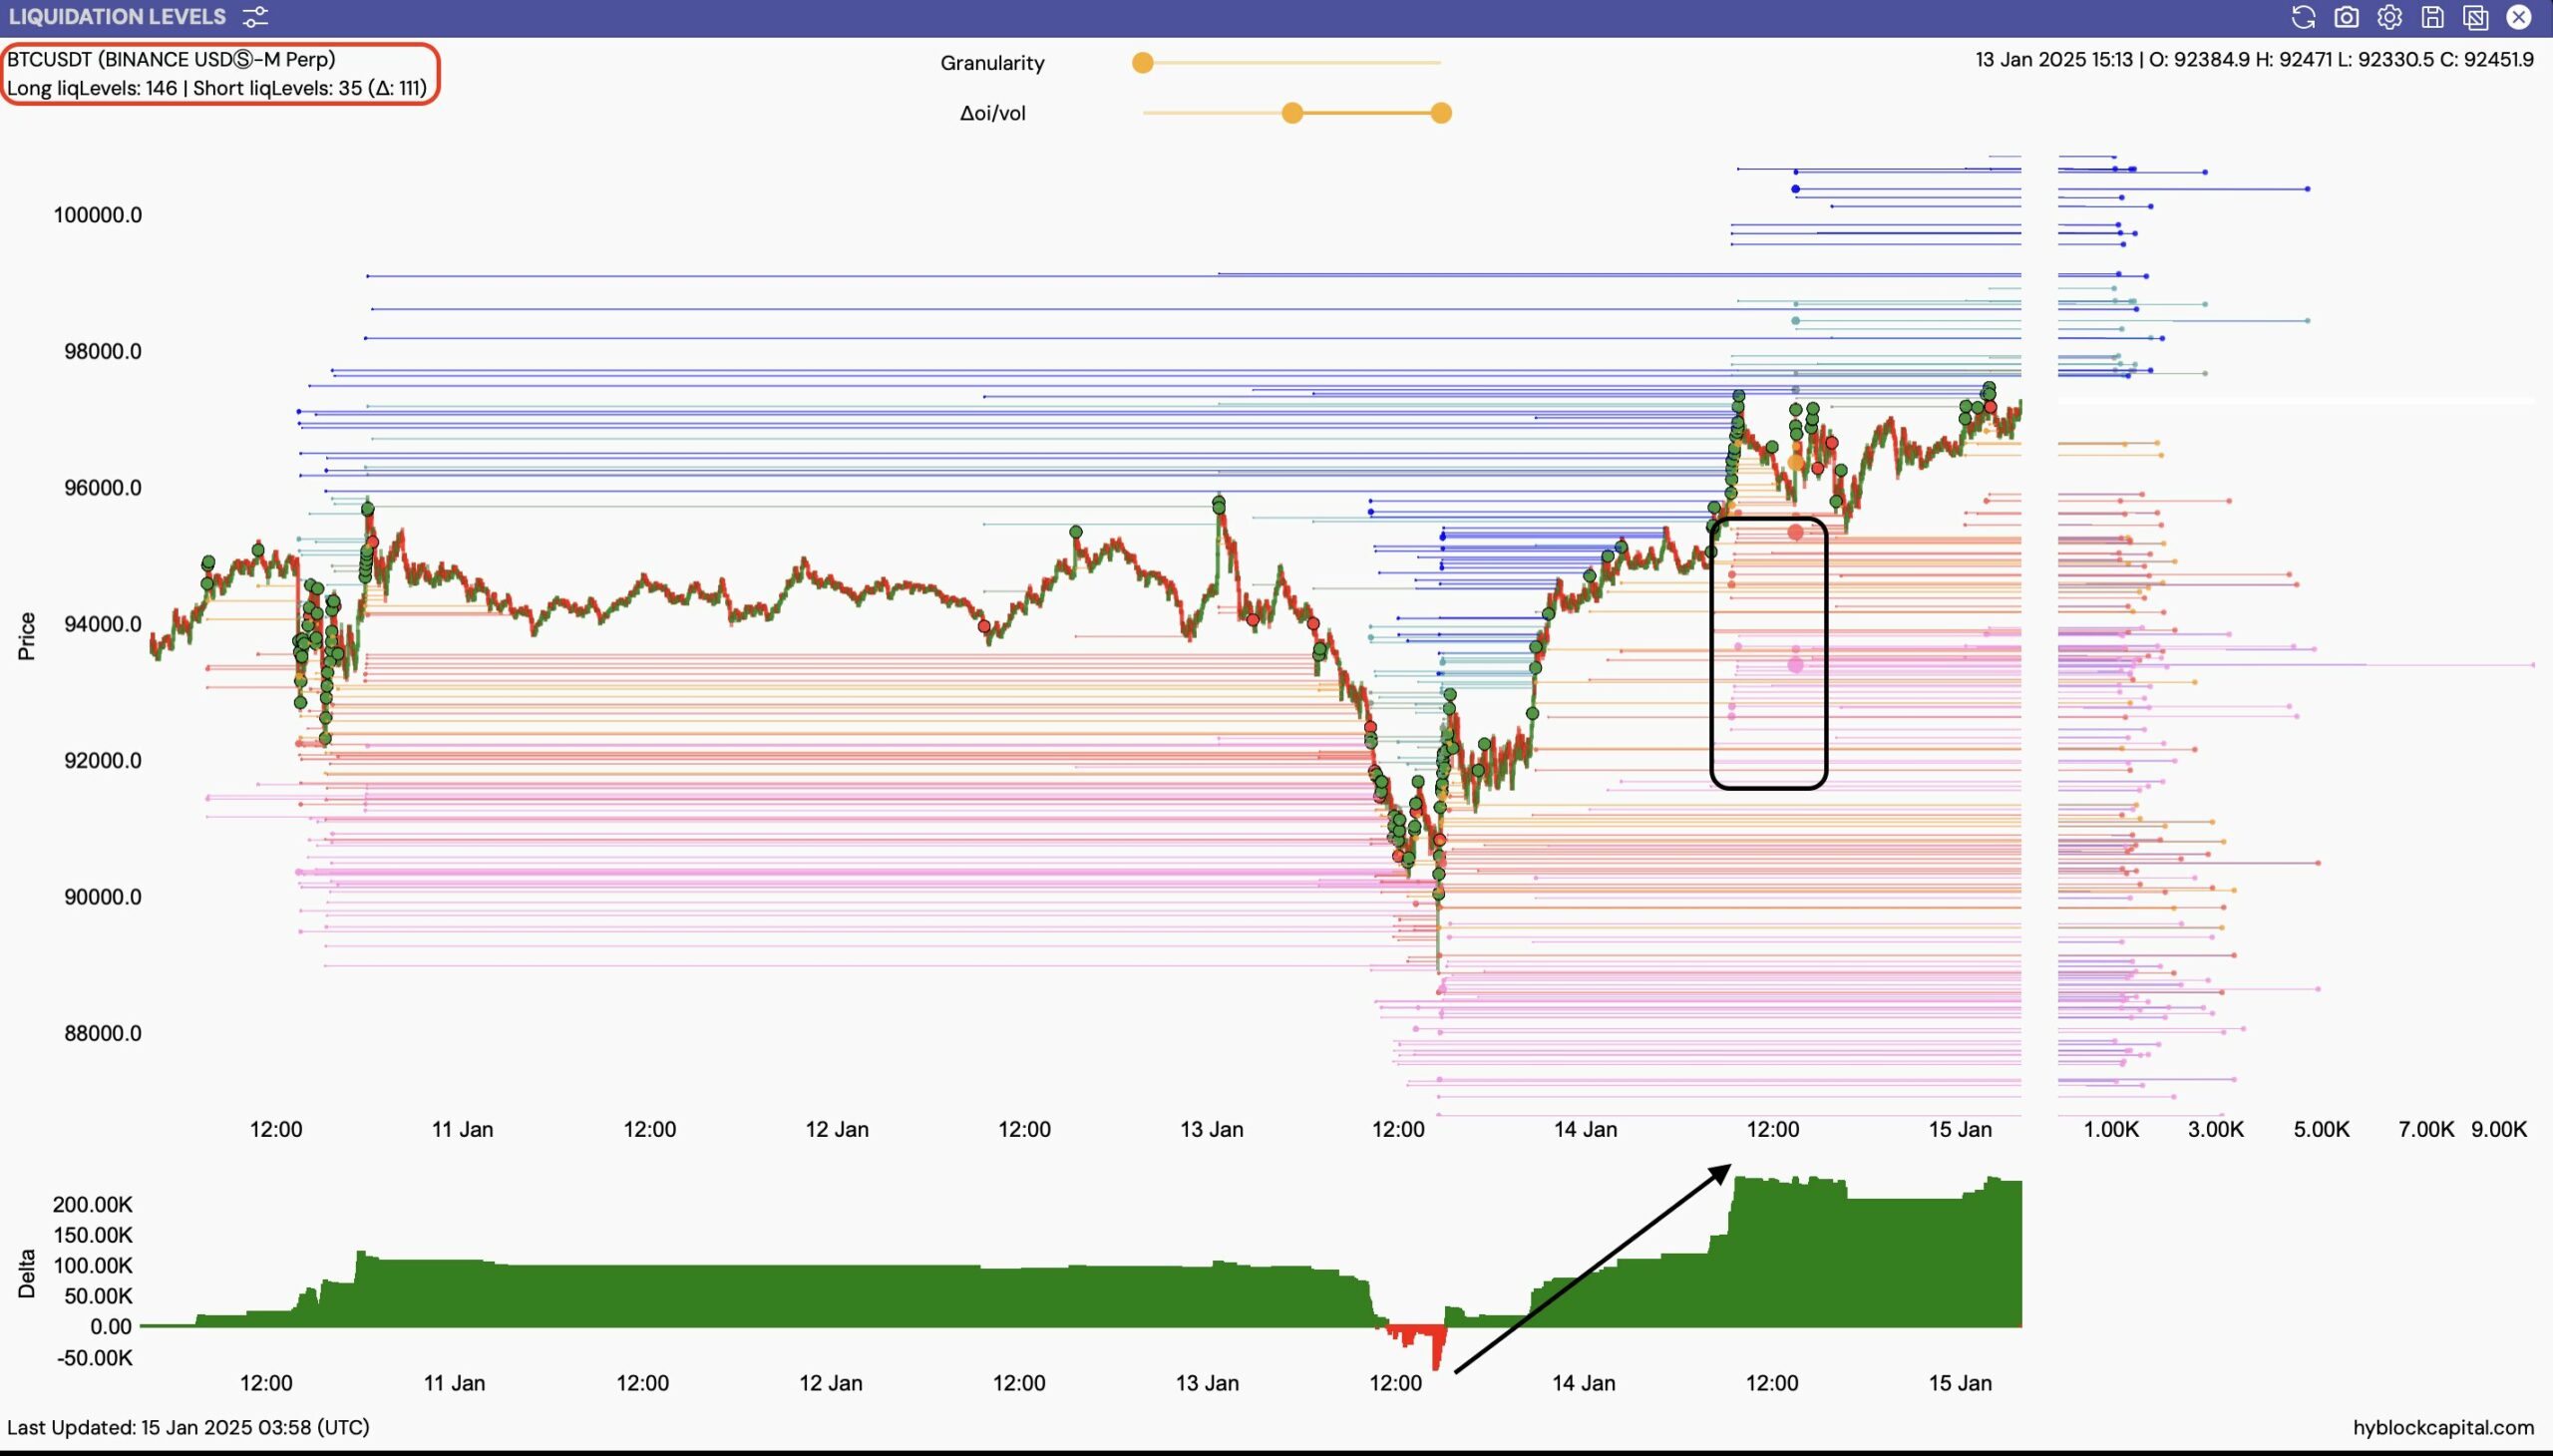
- Bitcoin has been seeing fewer short liquidity, levels compared to long liquidity levels
- BTC’s yearly high is one to break for the bulls to make another go for a new ATH.
Following Bitcoin’s latest uptrend on the charts, an analysis of the liquidation heatmap revealed a significant hike in long liquidity levels. In fact, this was particularly evident around the $90,000 price zone. This shift resulted in the foundation of support levels extending to $88,800 that were not tapped into, reinforcing a strong buy-in area for traders.
Conversely, short liquidity levels were less prevalent – A sign of a lack of bearish conviction among traders, indicating that the potential for decline may be limited.
This imbalance between long and short positions could imply a bullish outlook for BTC in the short term. If this is maintained, Bitcoin might challenge its upper resistance levels, further empowering bullish traders.
Significant long positions highlight market confidence, possibly driving the price towards higher benchmarks. Meanwhile, fewer short positions reduce the chance of significant price drops, creating a favorable setting for further price gains.
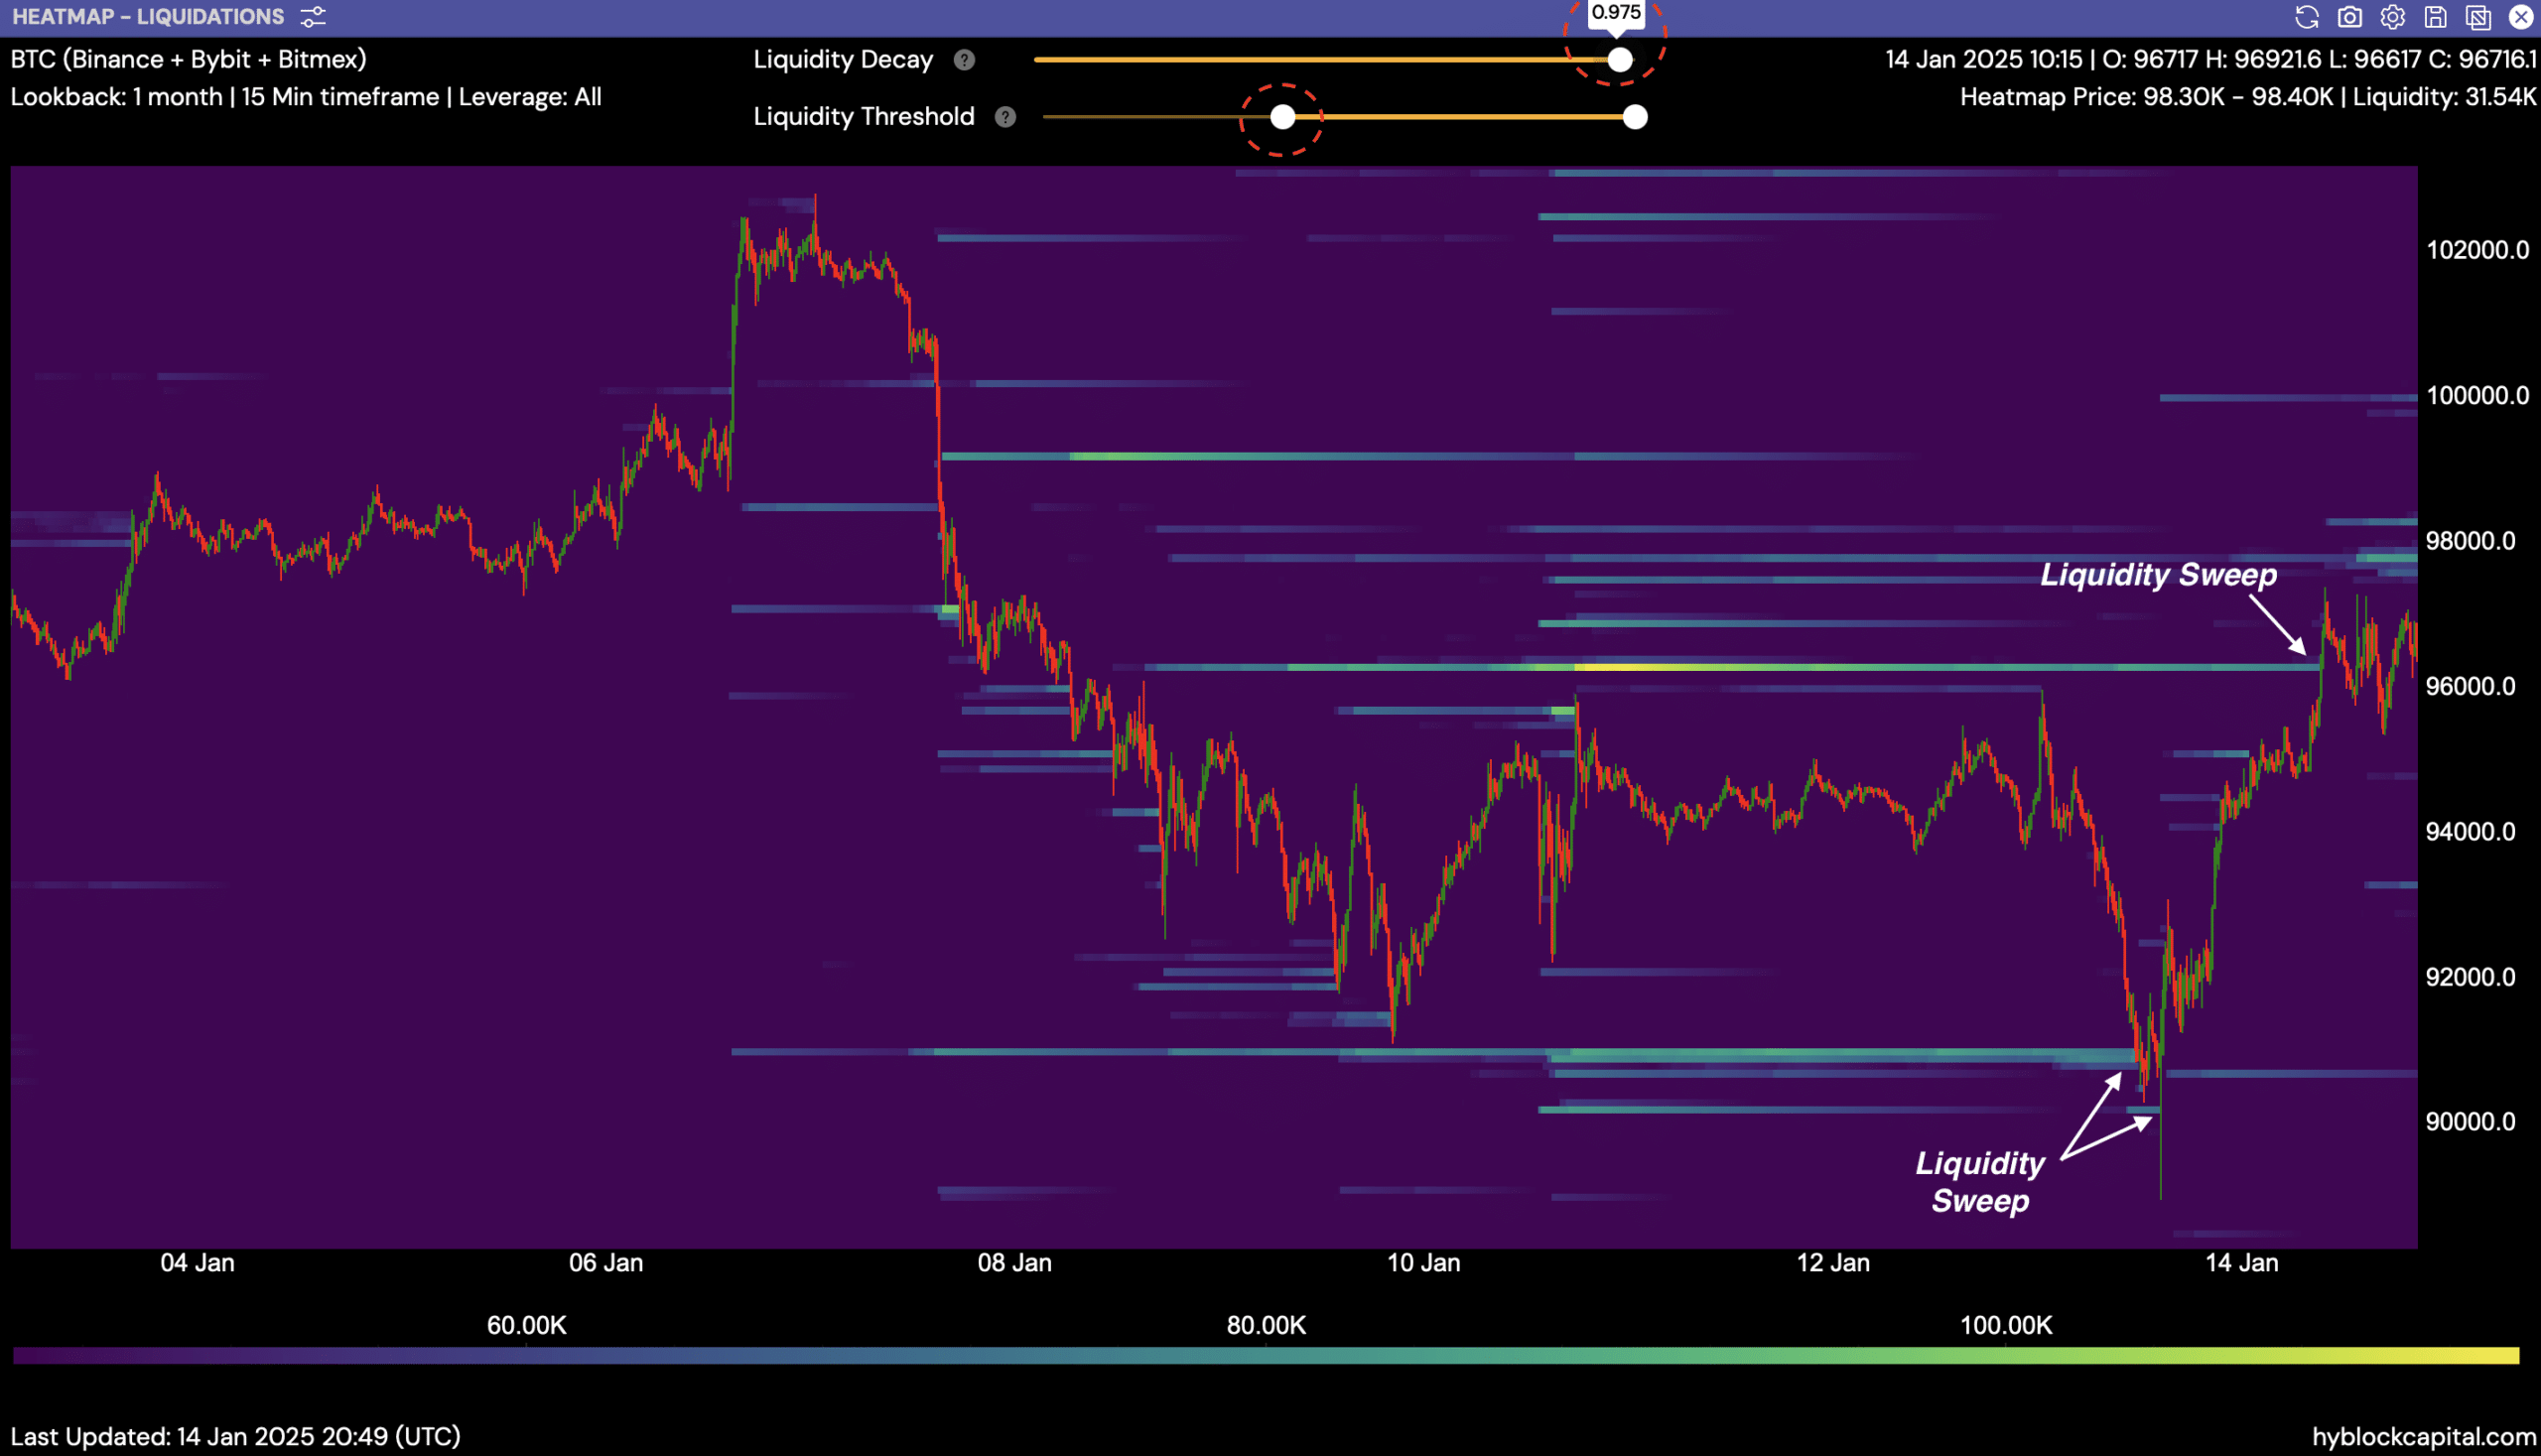
Liquidity sweeps on both sides
Looking at the behavior of the price, BTC seemed to be sweeping liquidity clusters on both sides of around $90k, where significant buying occurred, prompting a rapid hike to its current levels. Notable price levels were near $98,300 and $96,700, as evidenced by multiple liquidity sweeps visible at these zones.
The recent upswing to just below $98,400, followed by a retraction, underscored the pivotal role these clusters play in determining short-term price movements.
Go to Source to See Full Article
Author: Lennox Gitonga