
Bitcoin [BTC] traded near $68,700 at press time after a 30% retracement, reflecting controlled deleveraging rather than structural breakdown.
Profit-taking and ETF outflows triggered the decline, while macro risk aversion extended it.
Yet the spot remains well above the $54,900 aggregate realized price, preserving a profitability buffer.
Meanwhile, long-term holders anchor the cost basis near $40,600, steadily absorbing sell pressure. Their inactivity tightens liquid supply, thereby muting full capitulation dynamics.
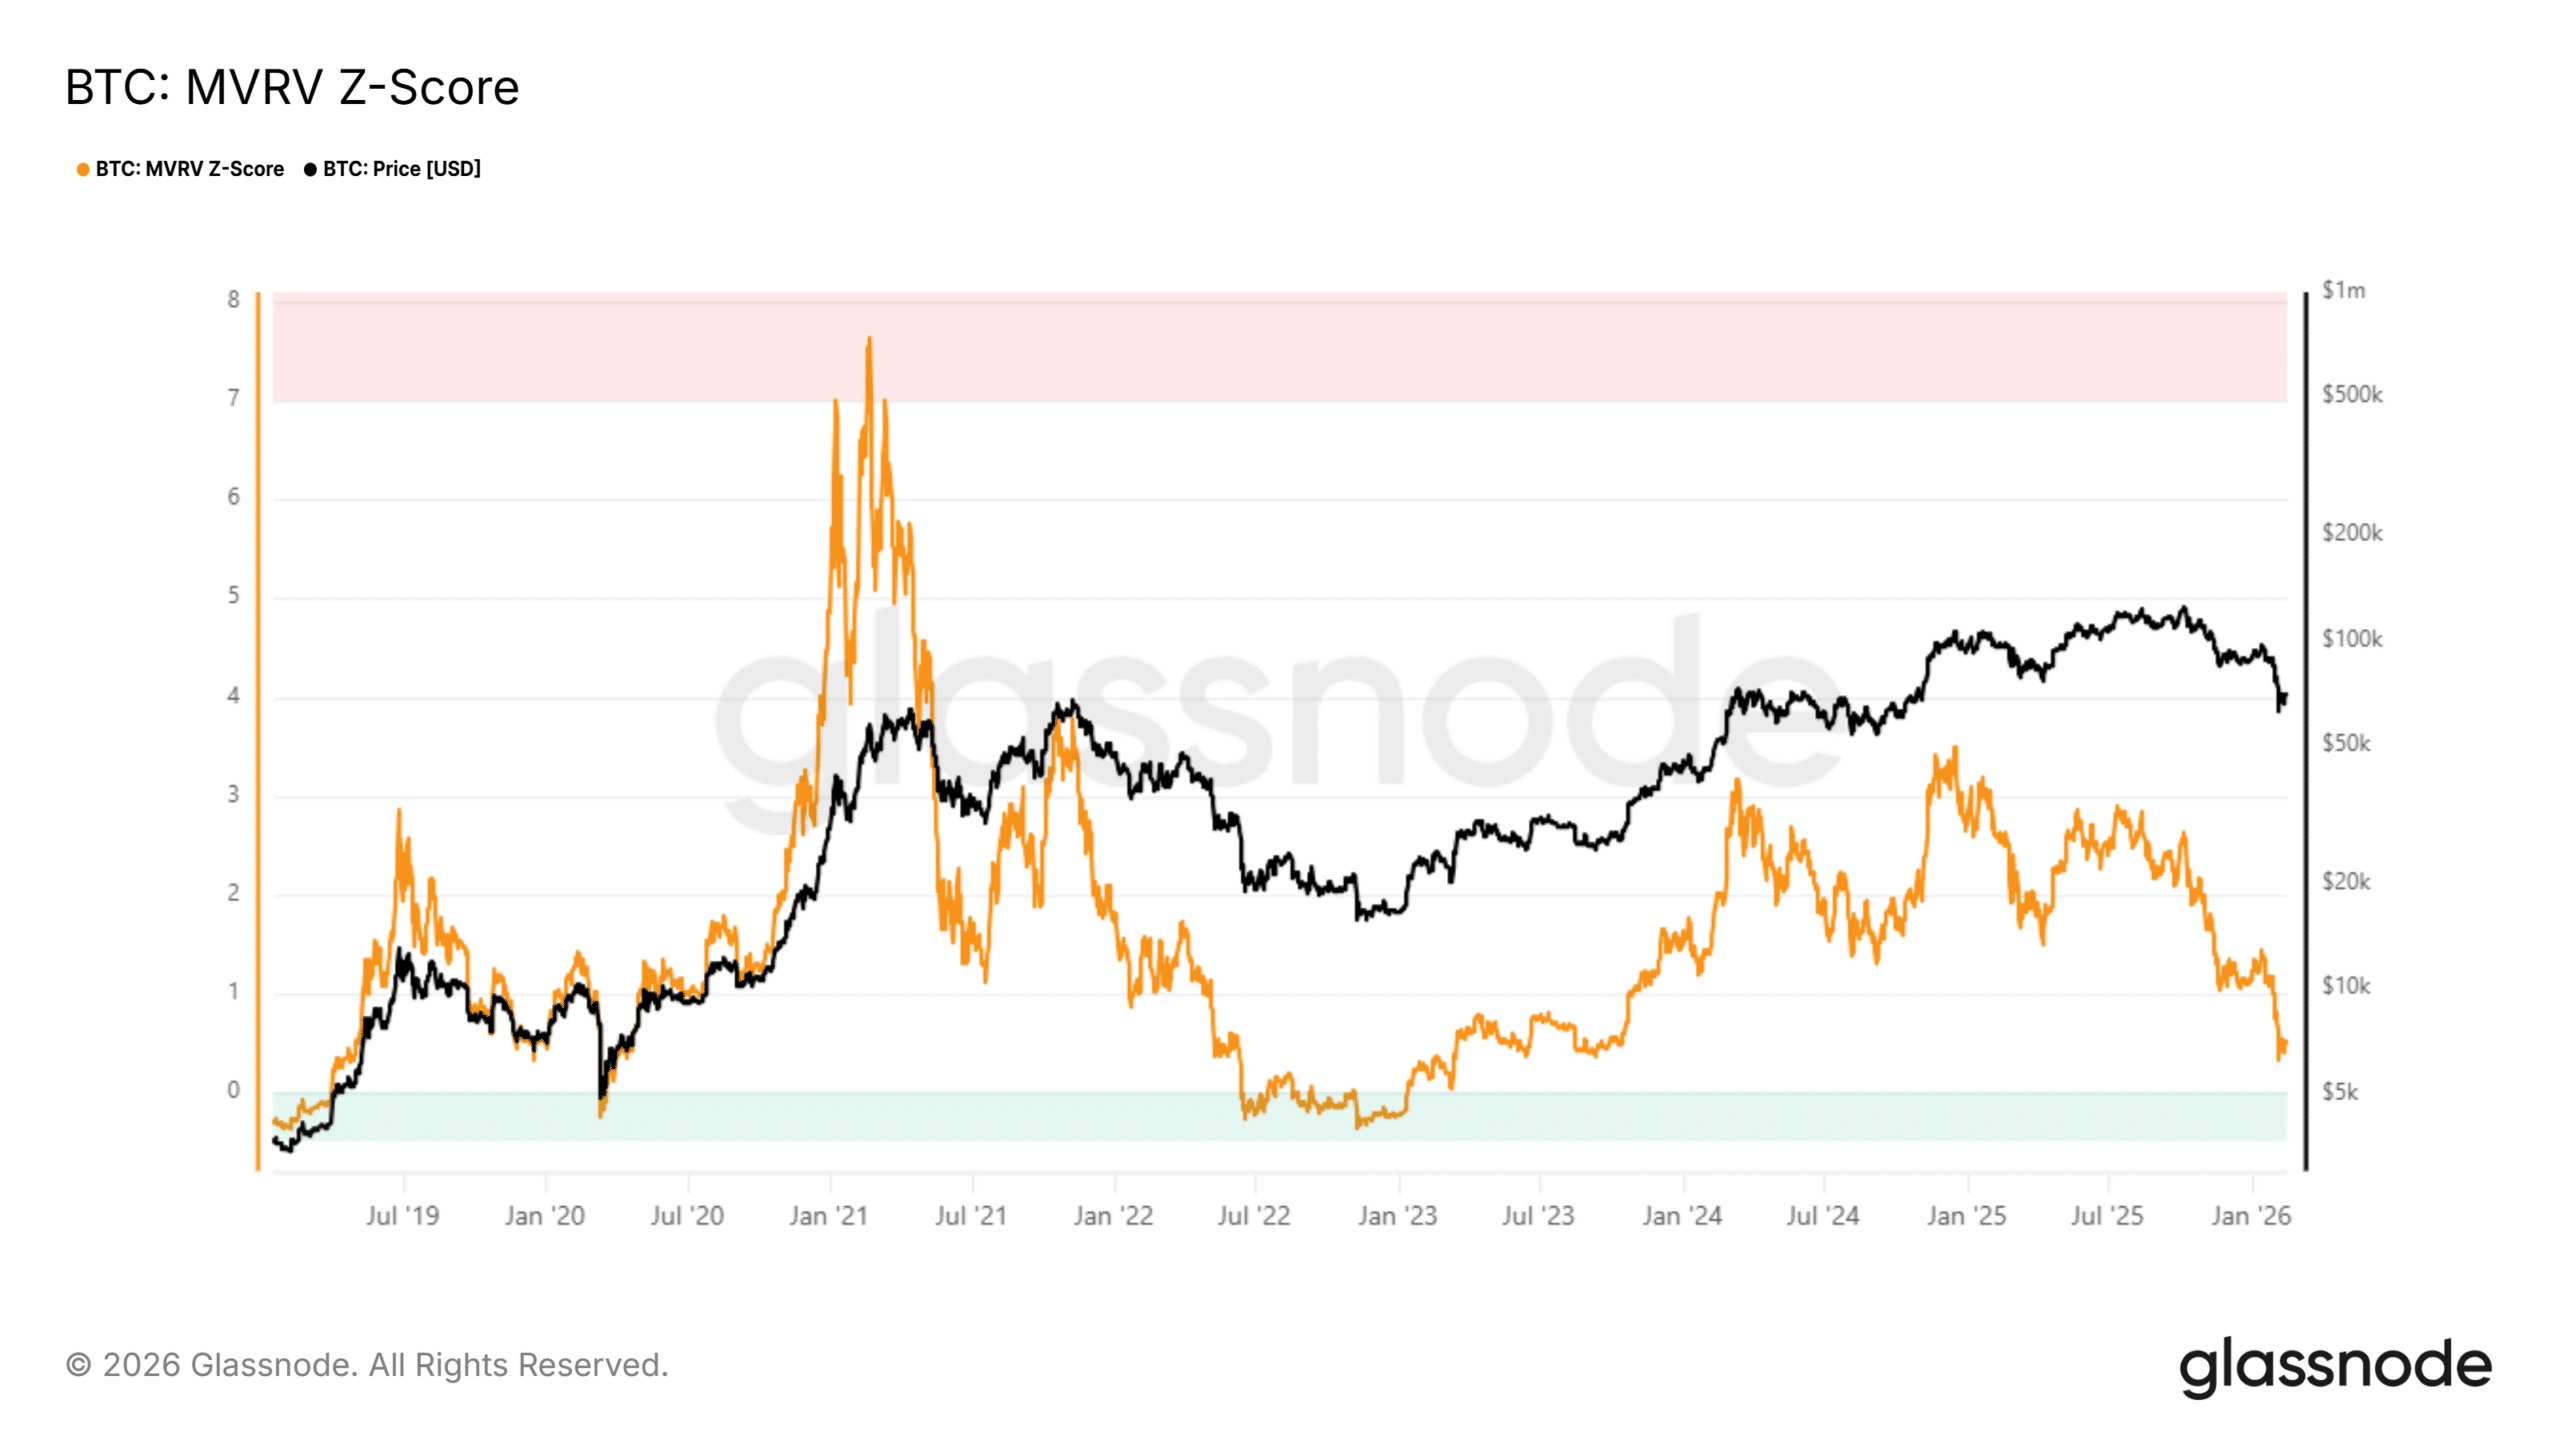
Source: Glassnode
In contrast, the sub-seven-year supply cohort holds a higher realized cost, leaving recent entrants underwater and sustaining distribution. Thereafter, the MVRV Z-Score compresses toward 0.5, revisiting prior value zones.
Unlike in 2018 and 2022, prices remain structurally elevated as the realized cap expands. Altogether, this divergence signals mid-bear accumulation forming atop a higher cyclical base.
Whale re-accumulation reinforces mid-cycle compression
Large-holder activity intensifies as market correction extends and sentiment fatigue deepens. Transaction data shows whales adjusting exposure through Binance’s deep liquidity.
Notably, the 1,000–10,000 BTC cohort now commands 74% of total inflows. This dominance reflects strategic repositioning rather than passive custody transfers.
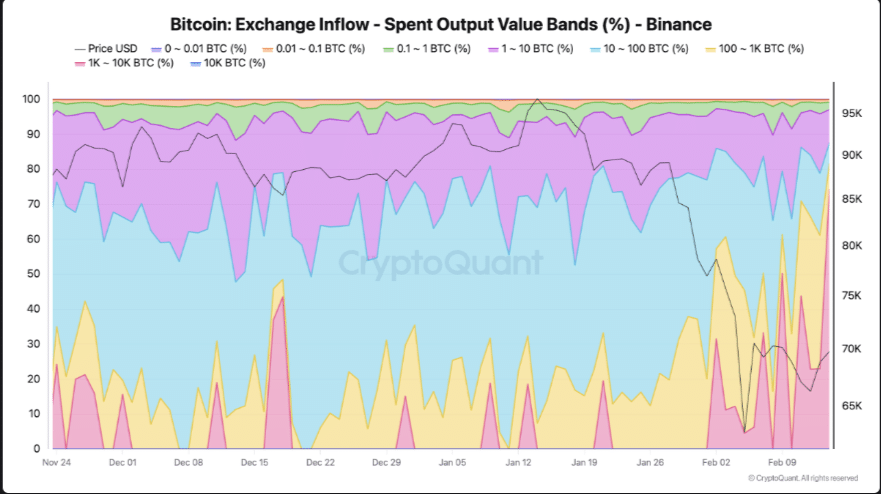
Source: CryptoQuant
Just days earlier, the 100–1,000 BTC group surged to 43% of inflows, signaling layered distribution. Together, these spikes point to escalating sell-side pressure from heavyweight actors.
Yet Bitcoin has held relatively stable, as residual demand absorbs portions of supply. This absorption slows downside momentum while revealing underlying fragility.
If large-flow pressure persists without stronger bids, structural strain may expand. Thereafter, downside probes could test the $60,000–$72,000 support band, reinforcing a cautious mid-cycle redistribution phase.
Shorts drive orderly redistribution
Bitcoin’s correction has matured into a fatigue phase, with price consolidating near $68,000–$69,000 after a 45–50% retracement from $126,000.
The drawdown began through leveraged unwinds and macro risk aversion, which first destabilized short-term holders.
As positions sank underwater, they realized the losses due to exit risk. On February 5, this capitulation peaked at $5.4 billion when the price dropped to $62,000.
Thereafter, seven-day realized losses averaged $2.3 billion, sustaining mechanical sell pressure.
This distribution flowed through spot markets and derivatives deleveraging, where funding briefly flipped negative as the longs closed. Meanwhile, long-term holders withheld supply, absorbing part of the shock.
The realized price held near $55,000, maintaining an 18–25% premium buffer. Altogether, forced selling met passive absorption, driving orderly redistribution and base-building within $55,000–$72,000.
Final Summary
- Capitulation remains localized to short-term holders, with price still holding above the $55,000 realized structural floor.
- Absent cost-basis breakdown and LTH distress, conditions reflect mid-cycle compression—not full bear capitulation.
Go to Source to See Full Article
Author: Muriuki Lazaro