Disclaimer: The information presented does not constitute financial, investment, trading, or other types of advice and is solely the writer’s opinion.
- The market structure of Bitcoin showed further downside was possible.
- This process could take time, and traders can keep an eye on liquidity to the north for selling opportunities.
Bitcoin [BTC] appeared to have decided on the direction of its next major price move. After the shift in market structure in July, the bears have slowly but steadily pushed BTC lower. Selling pressure intensified over the past three days.
Read Bitcoin’s [BTC] Price Prediction 2023-24
A recent report highlighted findings that supported the idea of a bearish move for BTC. The price action and momentum also favored the sellers. How low could the correction go? Just as importantly, how much longer could this downward move go?
Bitcoin volatility picks up after the drop below $29.1k
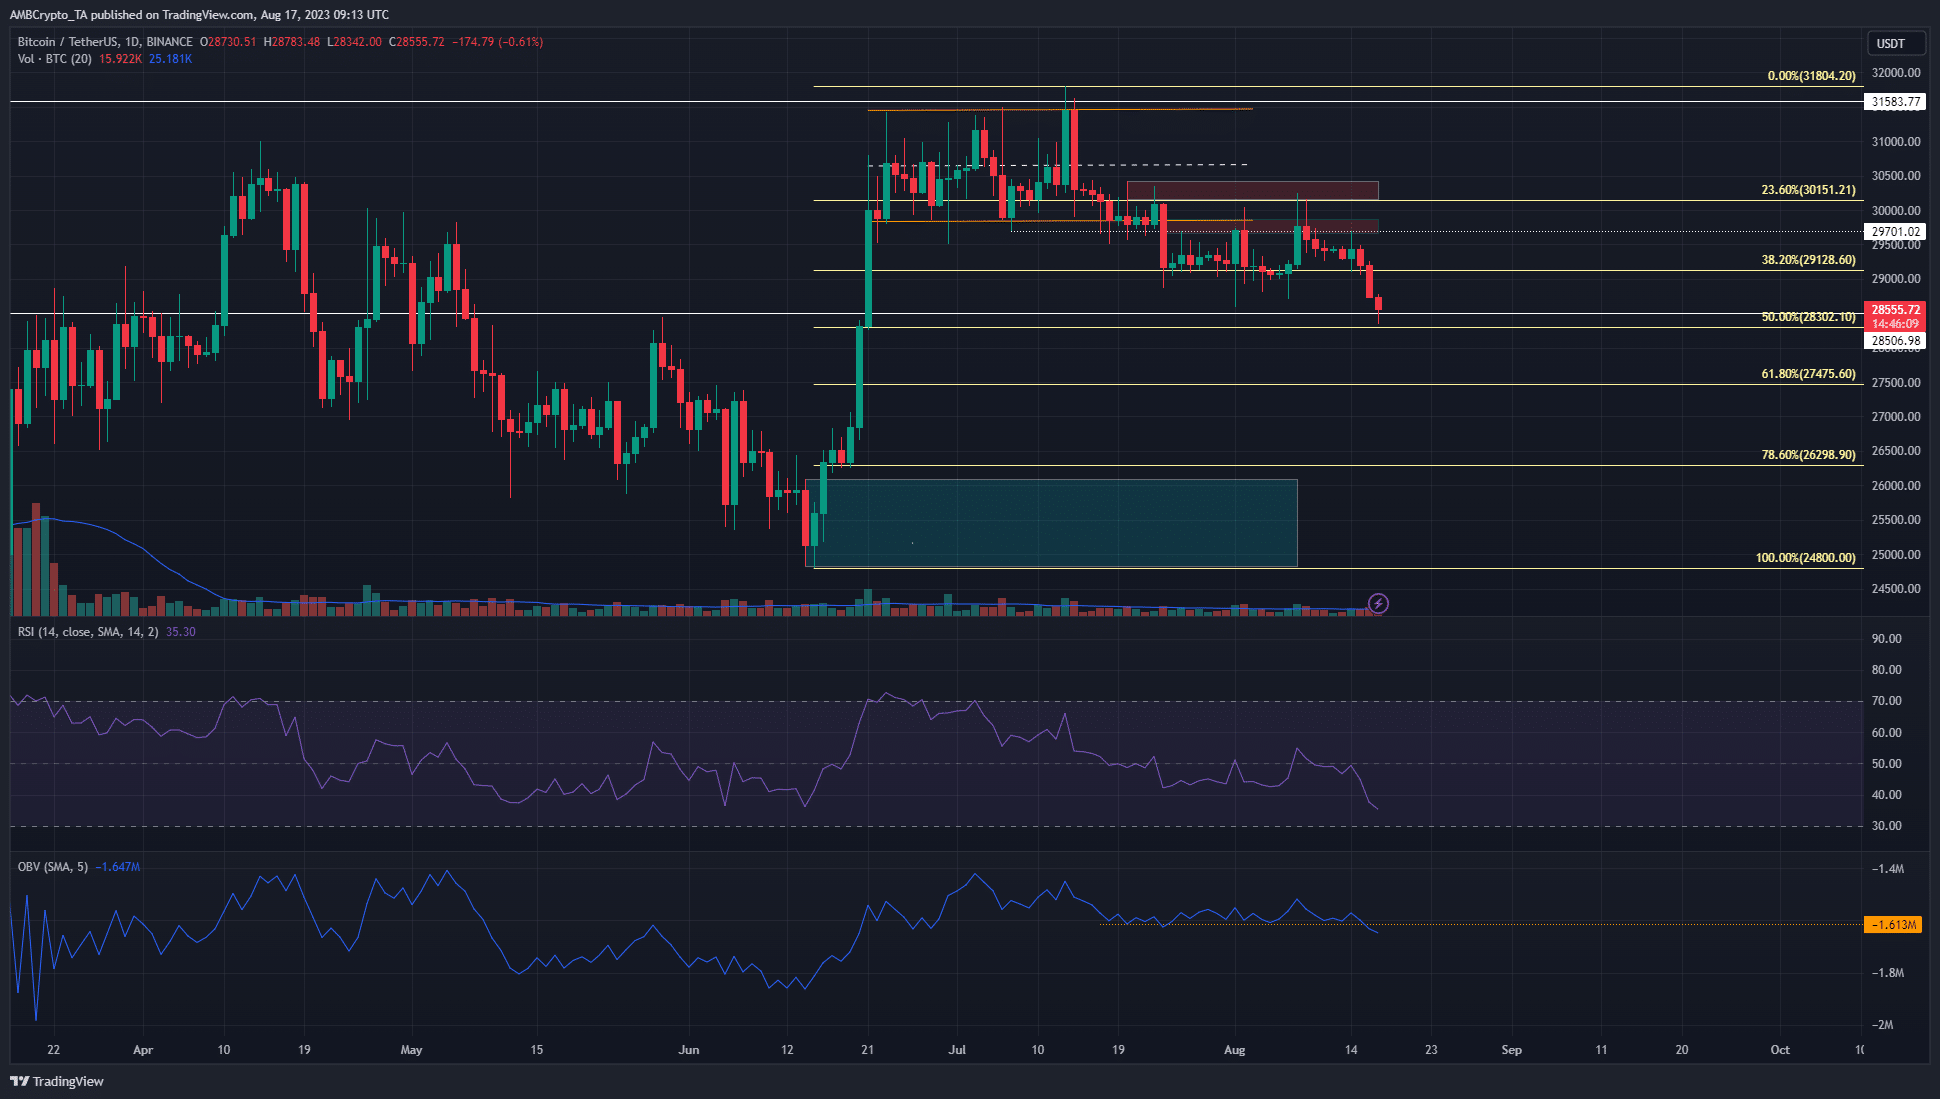
The Fibonacci retracement levels for the June rally showed that there were further support levels to the south. The $28.3k and $27.5k levels have been significant since March. BTC could stall and move sideways on the chart for an extended period at those levels.
The market structure on the daily chart was flipped bearish on 24 July when Bitcoin fell below the $29.5k level, revealing bearish intent. Over the past three days, the $29.1k level was ceded to the sellers as well.
The OBV fell below a short-term support level, signaling selling pressure had won this battle. The RSI has also been below neutral 50 since mid-July to highlight bearish momentum.
A retracement as deep as the 78.6% level at $26.3k was possible. Yet, such
Go to Source to See Full Article
Author: Akashnath S
Tip BTC Newswire with Cryptocurrency
Donate Bitcoin to BTC Newswire

Donate Bitcoin Cash to BTC Newswire

Donate Ethereum to BTC Newswire

Donate Litecoin to BTC Newswire

Donate Monero to BTC Newswire

Donate ZCash to BTC Newswire


