- Bitcoin struggled against $67,583 resistance; breaking this level could trigger a move toward $70,000.
- RSI and MACD show weakening momentum, while rising active addresses suggest potential bullish activity.
Bitcoin [BTC] fell below $67,000, reaching an intraday low of $65,700 after losing its overnight gains. Priced at $66,972.95 at press time, it shows a 1.22% decline in the past 24 hours and 2.01% over the past week.
Despite the short-term dip, Bitcoin’s market cap remains at $1.32 trillion, with a circulating supply of 20 million BTC. In the last 24 hours, trading volume reached $46.32 billion, reflecting continued interest from traders.
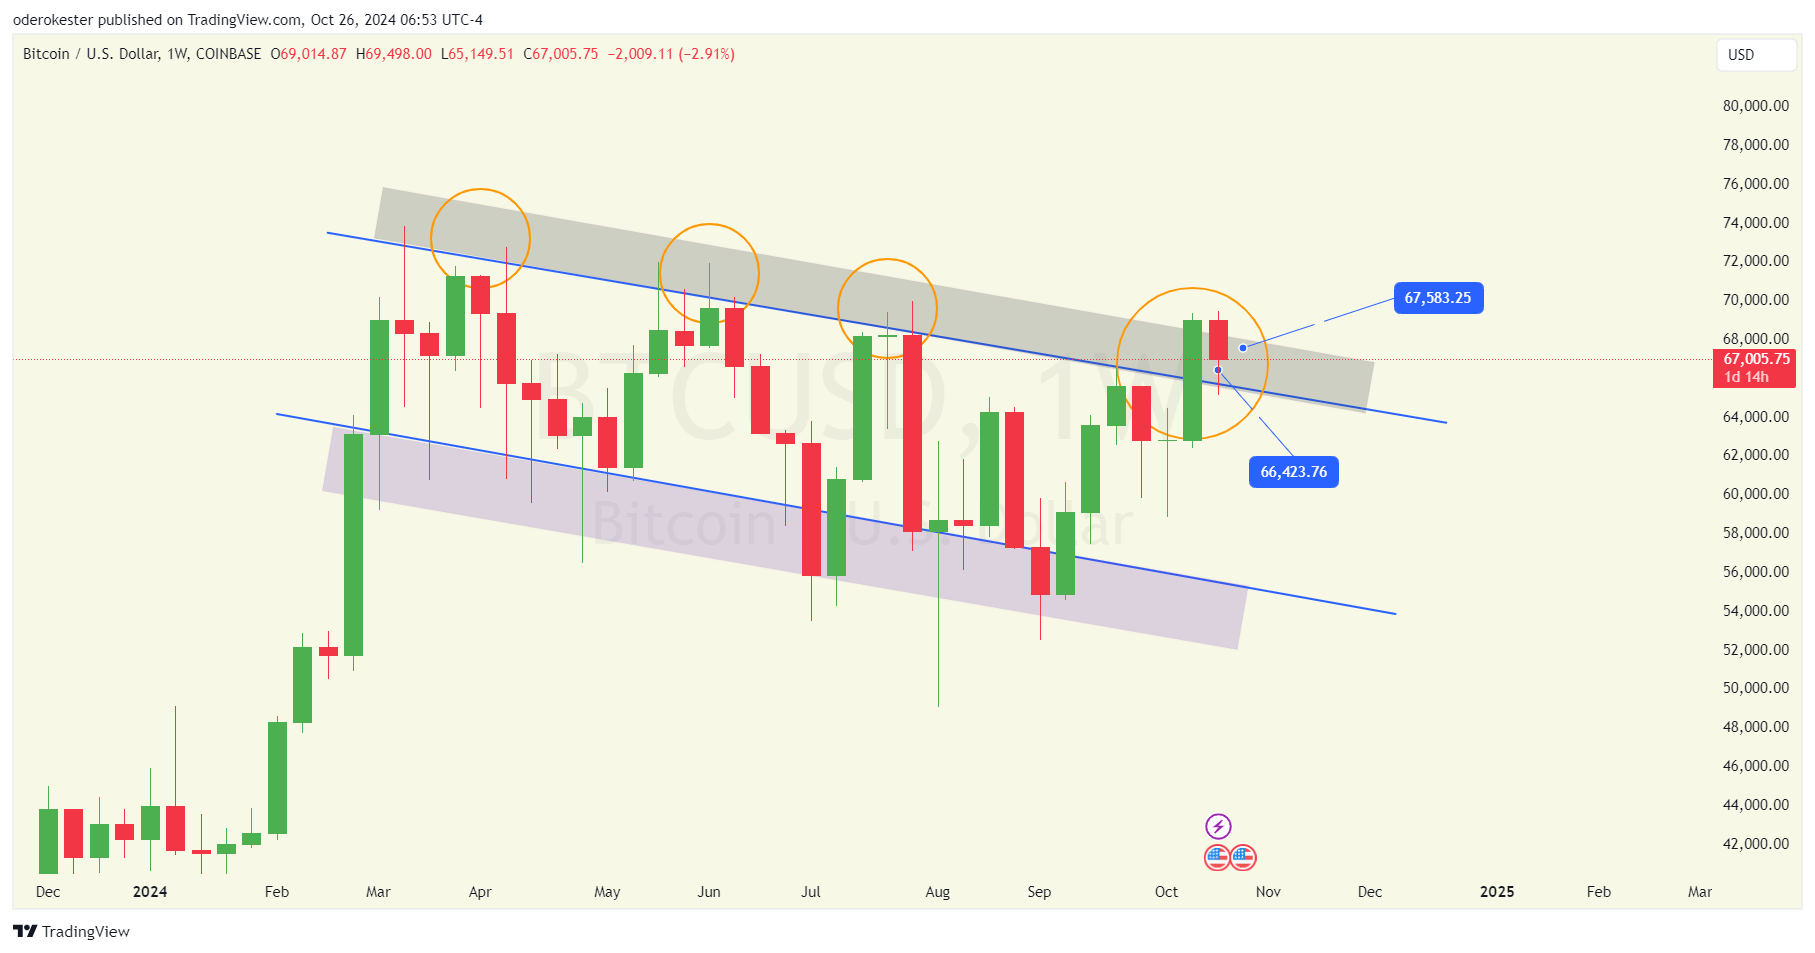
Bitcoin has been trading within a clear descending channel. This pattern shows a series of lower highs and lower lows, indicating a bearish trend.
The upper boundary of this channel, near $69,000, has repeatedly acted as a strong resistance level, pushing prices lower after each attempt to break above it.
As seen on the chart, recent rejections have followed similar patterns, suggesting that this resistance remains a key challenge for further gains.
Source: TradingView
Support and resistance levels
Bitcoin’s press time upper resistance zone was between $67,583.25 and $69,000, a range that has consistently rejected bullish attempts.
If Bitcoin manages to break above this range, it could pave the way for an extended move toward $70,000.
However, failure to clear this level could see Bitcoin reverting lower within the descending channel.
Immediate support is identified around $66,423.76, marked as a critical level on the chart. Should Bitcoin breach this support, it could drop toward the lower boundary of the channel, projected between $60,000 and $62,000.
RSI and MACD analysis
At the time of this publication, Relative Stre
Go to Source to See Full Article
Author: Olivia Stephanie