Disclaimer: The information presented does not constitute financial, investment, trading, or other types of advice and is solely the writer’s opinion.
- The price action of BCH and retracement levels lined up pretty well near the $200 mark.
- Yet this could be precisely why such a retracement could be risky for the buyers.
Bitcoin Cash [BCH] embarked on a rally that measured 214% in magnitude. The bulls accomplished this feat in under two weeks. While the price action and indicators showed strong bullishness, this was not a time for FOMO.
Is your portfolio green? Check the Bitcoin Cash Profit Calculator
Traders can instead look to capitalize on a retracement if the market gives one. But Fib retracement levels are a popular tool, and if the entire market is looking at certain levels for a bullish reaction, it could become easy to trap the bulls before the real move.
Will Bitcoin Cash retrace some of its vast gains?
It was very likely that BCH would retrace at least a portion of its recent gains. But how much would that be? Will the bears begin to shed all the gains from the vertical upward move? This was possible. But with Bitcoin having a bullish bias on the higher timeframes, there could be another bullish move left for BCH in the coming weeks or months.
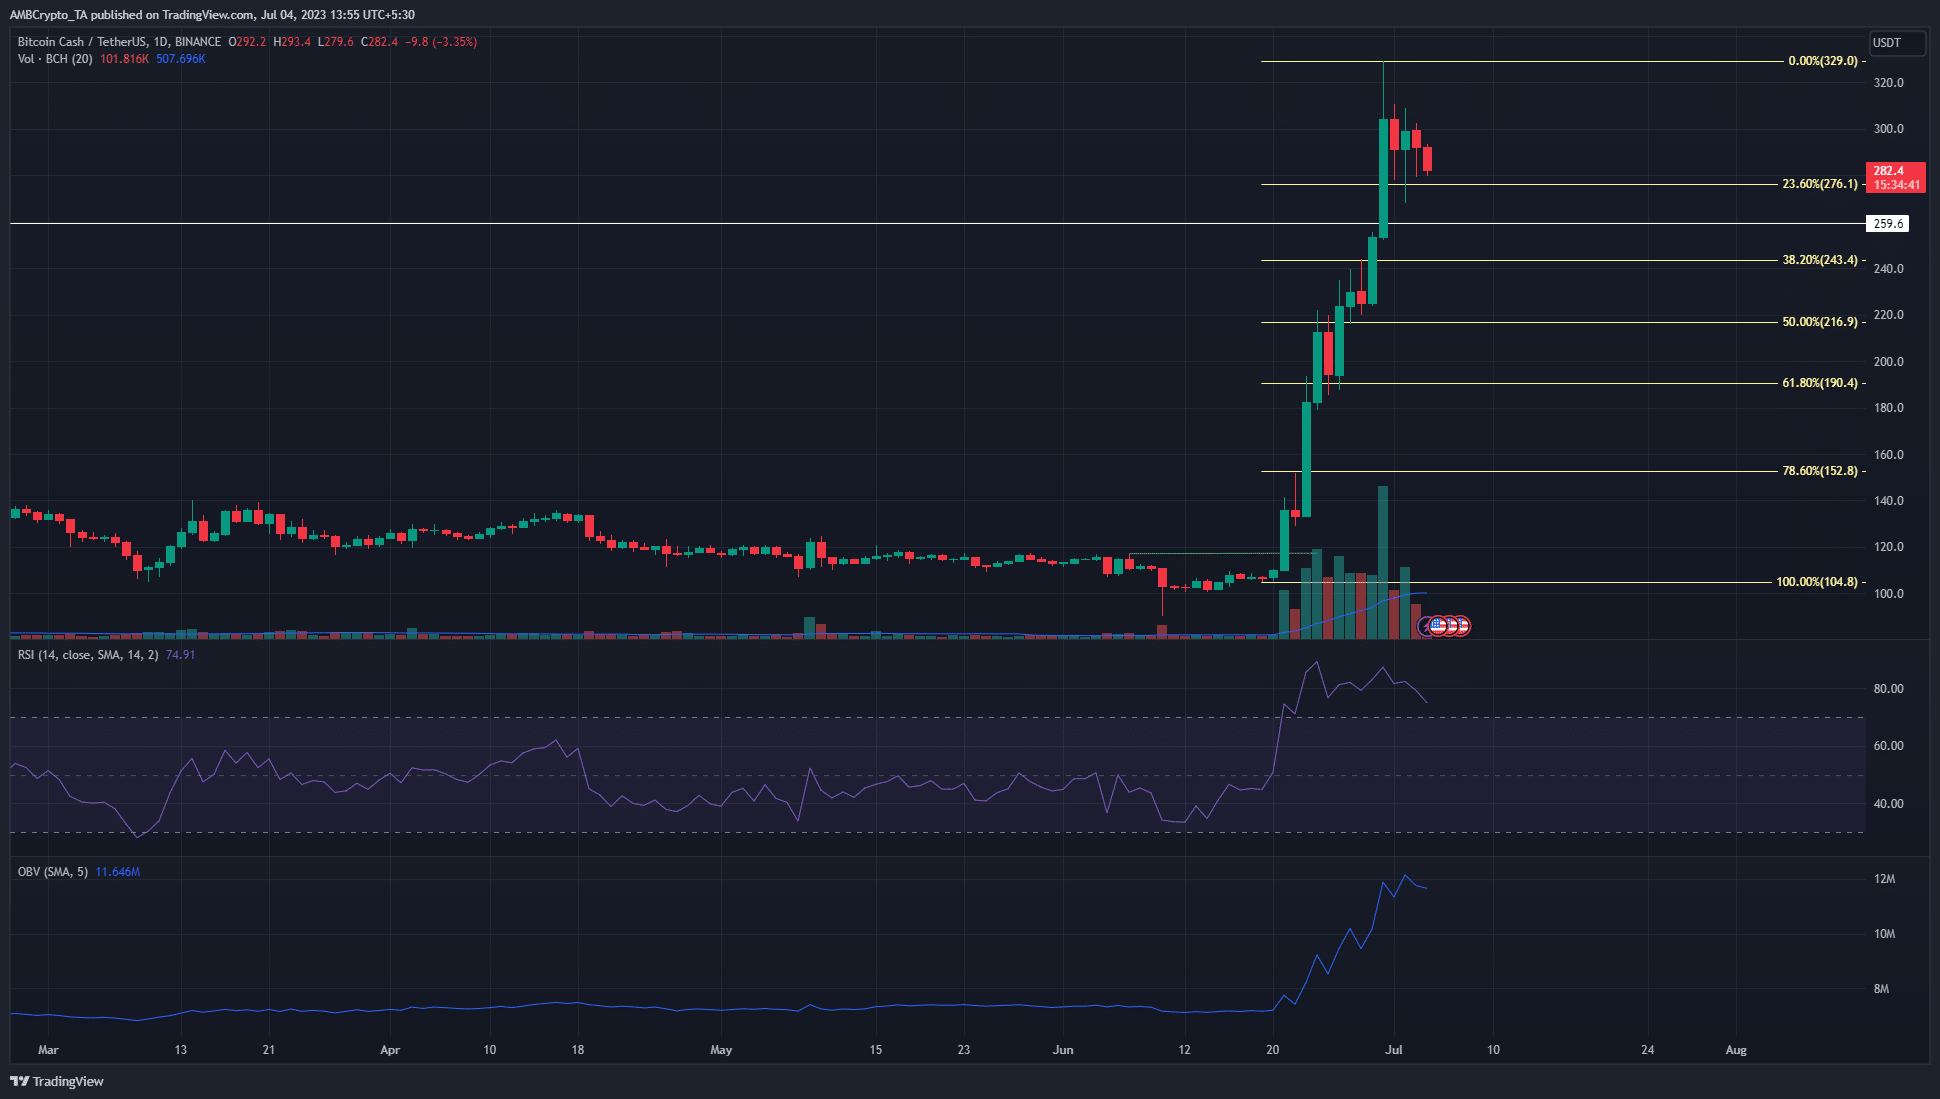
The RSI began to form a bearish divergence while BCH fell close to 15% from the high at $329. However, the price action remained strongly bullish. The Fibonacci retracement levels were drawn after BCH flipped its structure to bullish on the 1-day timeframe.
The 50% and 61.8% retracement levels lie at $190.4 and $216.9. Interestingly, a large red candle was present in this zone as well. Formed on 25 June, this area represented a region where some lower timeframe consolidation occurred before the explosive surge past $300.
Go to Source to See Full Article
Author: Akashnath S
Tip BTC Newswire with Cryptocurrency
Donate Bitcoin to BTC Newswire

Donate Bitcoin Cash to BTC Newswire

Donate Ethereum to BTC Newswire

Donate Litecoin to BTC Newswire

Donate Monero to BTC Newswire

Donate ZCash to BTC Newswire


