Disclaimer: The information presented does not constitute financial, investment, trading, or other types of advice and is solely the writer’s opinion
- Bitcoin Cash has strong bullish conviction in the near term
- The rally from the 61.8% retracement level meant BCH prices could rocket higher once again
Bitcoin Cash [BCH] has healthy bullish prospects across multiple timeframes. Both the four-hour chart and the one-day chart had a bullish structure at the time of writing. Added to this was the success the buyers had recently when they succeeded in breaching a month-long resistance.
Read Bitcoin Cash’s [BCH] Price Prediction 2023-24
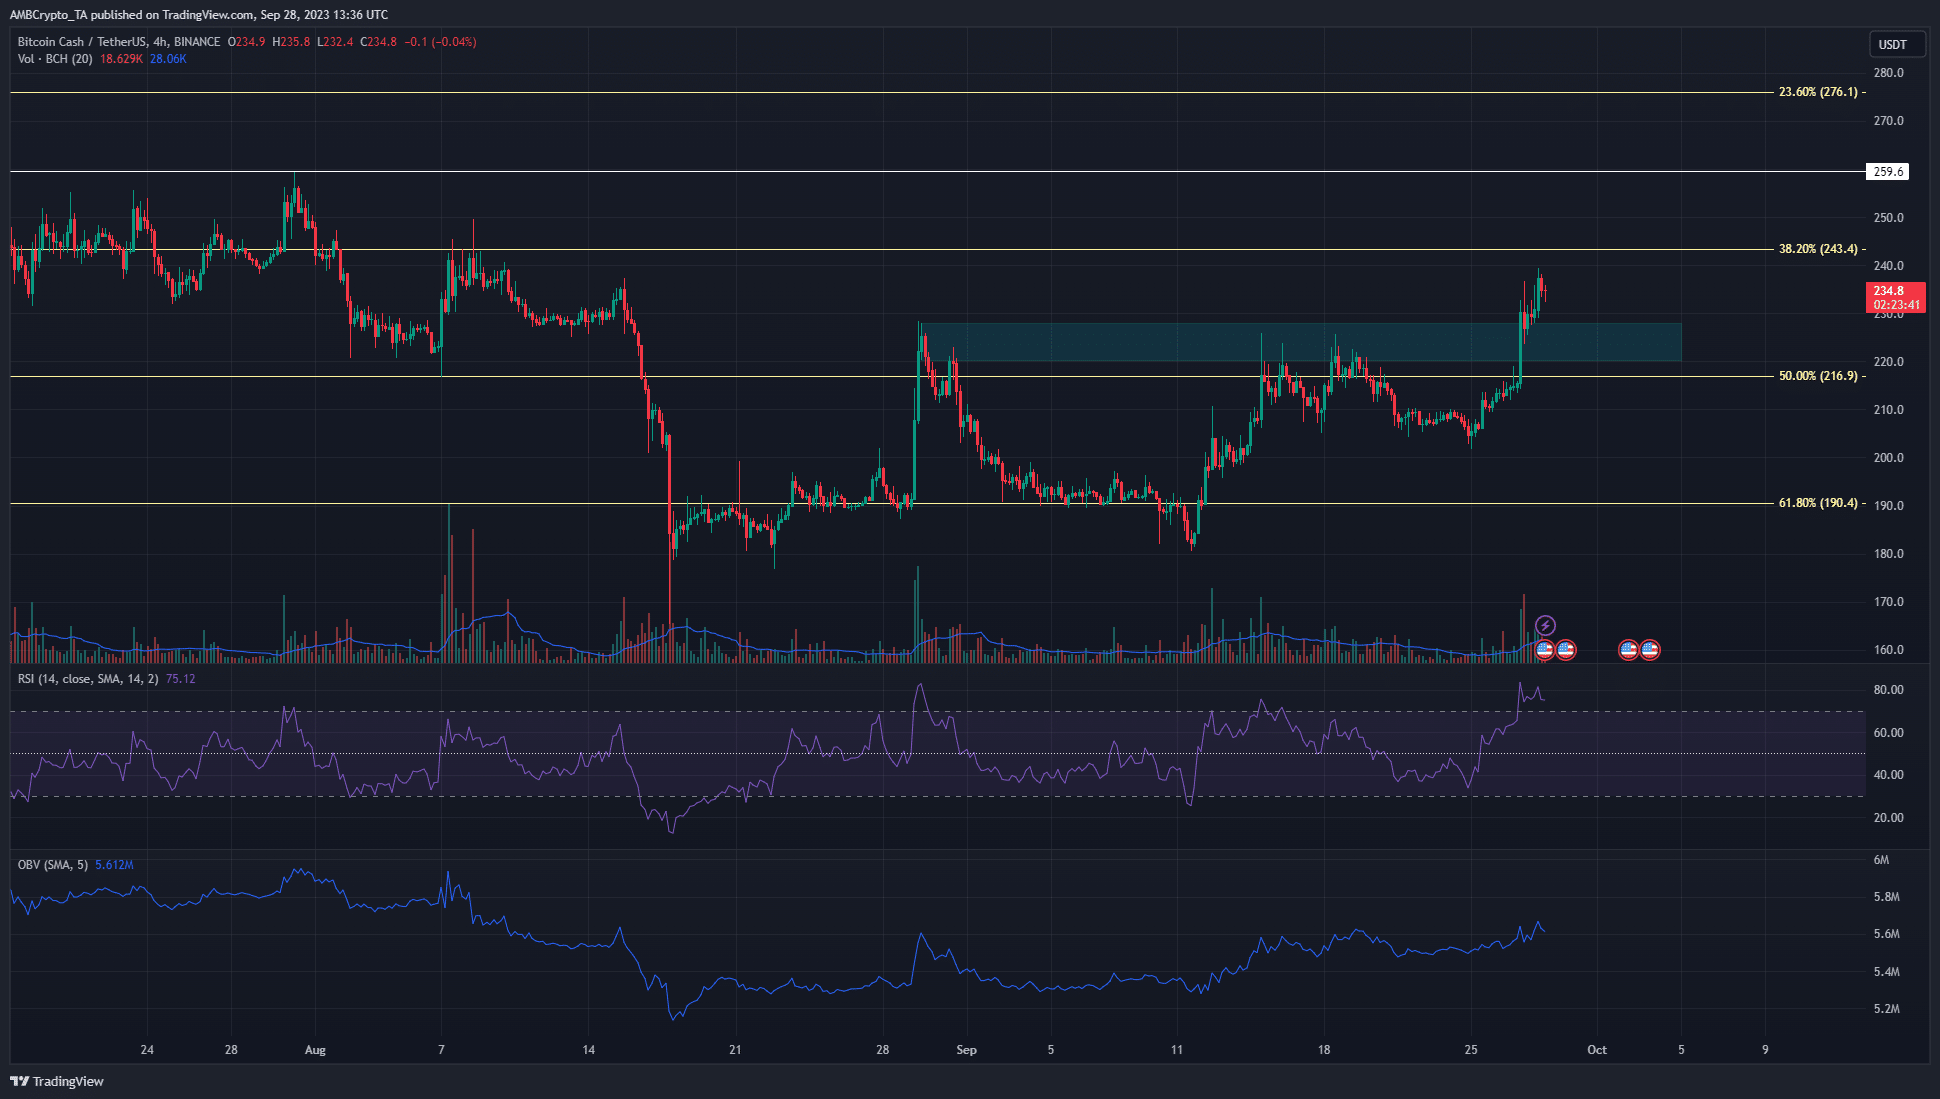
This resistance zone stretched from $220.3 to $228 and had been a bearish order block on the four-hour chart. A recent report by AMBCrypto noted that the $220 resistance zone was vital for the bulls to conquer. Now that they have, what can traders watch out for next?
The former resistance was now flipped to a support zone for BCH bulls to defend
The H4 bearish order block, once broken, became a bullish breaker block. It was retested on 27 September as support, and at the time of writing BCH was trading at $233.7. The move past the $228.4 level flipped the market structure bullishly on the daily chart.
On the four-hour chart, it had been bullish when BCH clambered above the $210.2 level a couple of days ago. The Relative Strength Index (RSI) was at 75 and indicated intense northward momentum. The On-Balance Volume (OBV) has been in an uptrend since 12 September.
The defense of the $190.4 region was crucial for bulls in the long term, as it represented a Fibonacci retracement level. These Fib levels were plotted based on BCH’s late June rally from $104 to $329. There
Go to Source to See Full Article
Author: Akashnath S
Tip BTC Newswire with Cryptocurrency
Donate Bitcoin to BTC Newswire

Donate Bitcoin Cash to BTC Newswire

Donate Ethereum to BTC Newswire

Donate Litecoin to BTC Newswire

Donate Monero to BTC Newswire

Donate ZCash to BTC Newswire


