Disclaimer: The information presented does not constitute financial, investment, trading, or other types of advice and is solely the writer’s opinion.
- The recent drop eased at a daily bullish order block and May range-low.
- Coinglass’s liquidation map marked $25.7k and $26.4k as key liquidity levels.
According to technical indicators on the lower timeframe charts, Bitcoin’s [BTC] short and mid-term prospects still don’t look good. In addition, over 80% of polled interest rate traders are inclined towards a possible Fed rate hike in the next September FOMC Meeting. This begs the question, are extra losses likely?
Is your portfolio green? Check out the BTC Profit Calculator
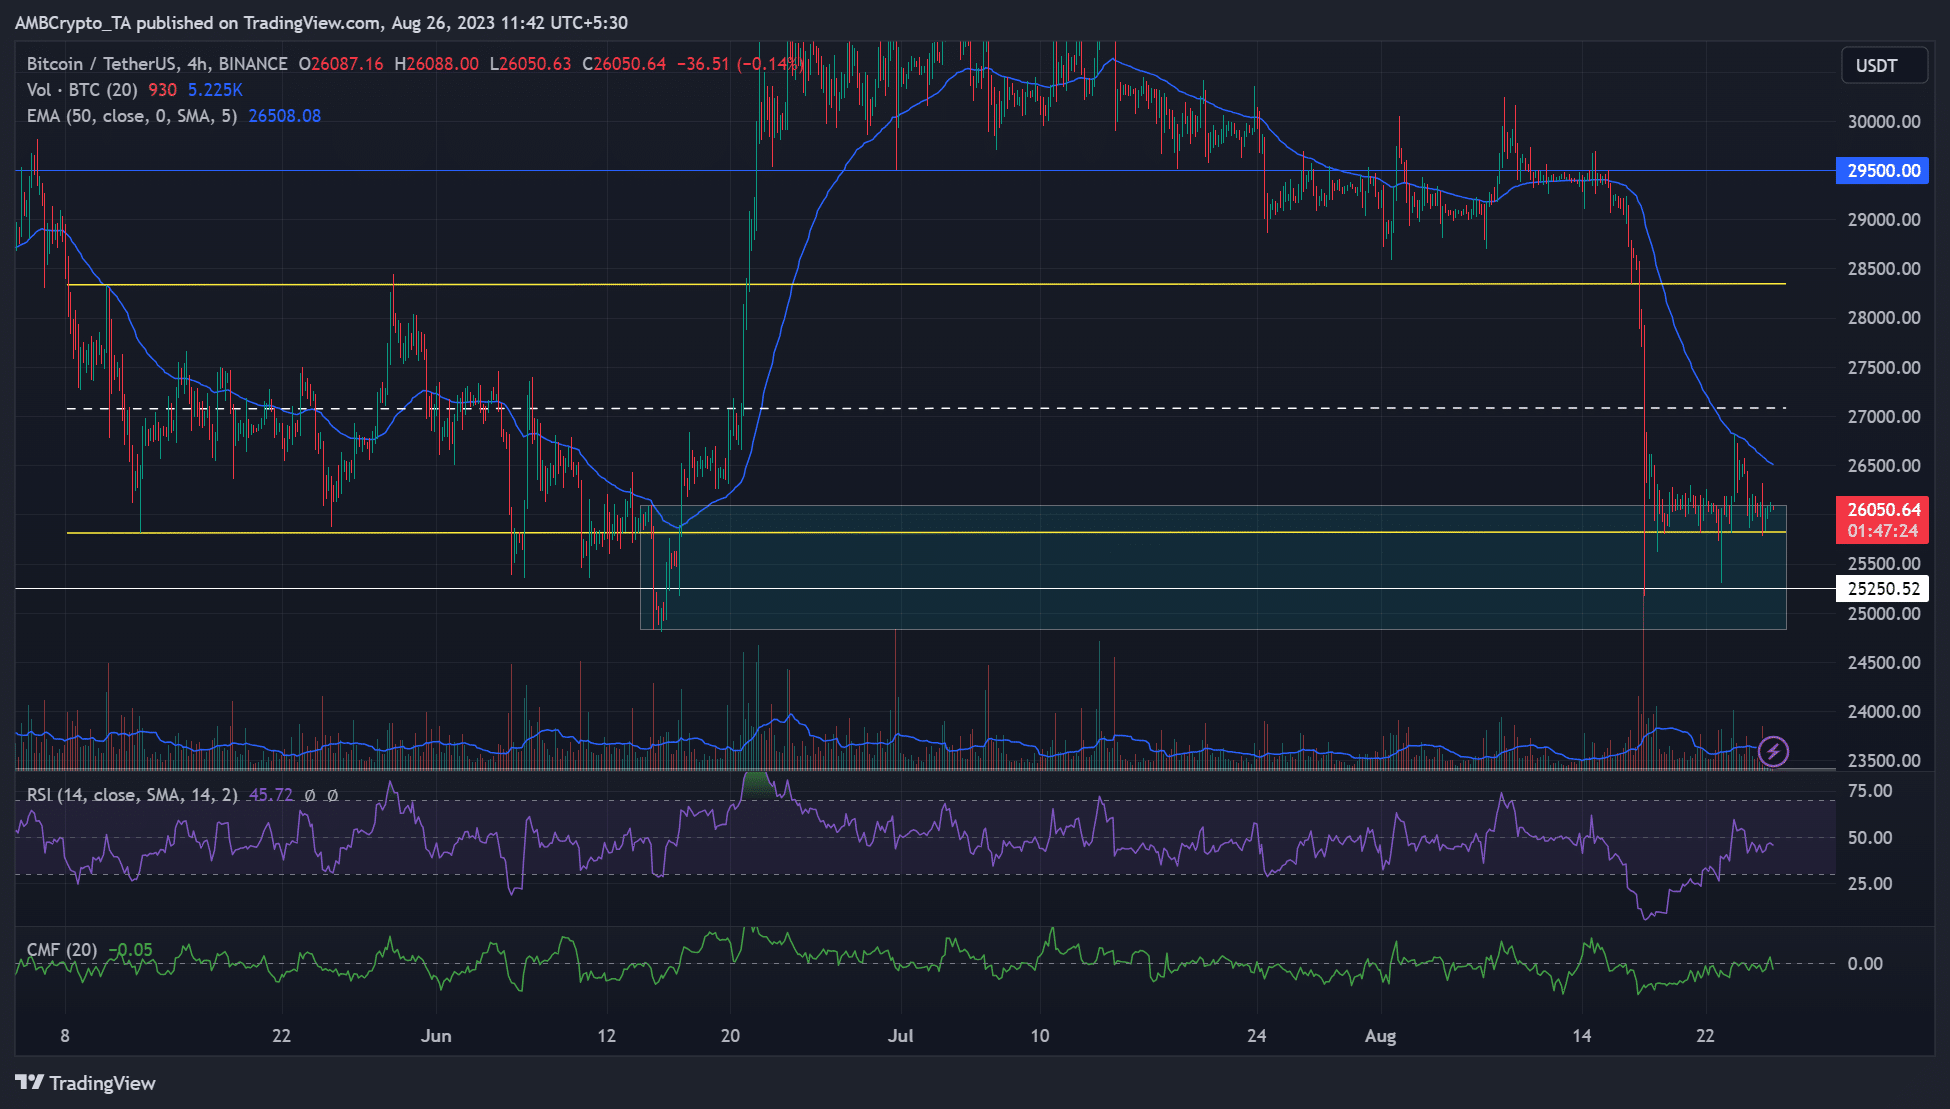
The recent price slump eased at a previous May range-low of $25.8k and a daily bullish order block (OB) of $24.8k – $26.0k (cyan). However, a solid recovery has remained elusive as bulls and bears tussle for $26k.
The H4 50-EMA retested as resistance
The zoomed 4-hour chart indicated that the current price levels coincided with the May range-low. BTC fluctuated between $25.8k and $28.3k in May, with a mid-range near $27k.
Interestingly, the above May range-low aligned with a daily bullish OB (cyan) and $25.2k support. The retest of the range-low could have led to a move up to the mid-range near $27k, but the price faced rejection at the 50-EMA (Exponential Moving Average) of $26.5k.
So, the mid-range and 50-EMA are crucial resistance levels for the next
Go to Source to See Full Article
Author: Benjamin Njiri
Tip BTC Newswire with Cryptocurrency
Donate Bitcoin to BTC Newswire

Donate Bitcoin Cash to BTC Newswire

Donate Ethereum to BTC Newswire

Donate Litecoin to BTC Newswire

Donate Monero to BTC Newswire

Donate ZCash to BTC Newswire


