Key Takeaways
What is the Bitcoin price forecast this week?
The $124k region would likely be flipped to support, but there is also a minor chance of a retest of the $119k support, as it was a key moving average.
Do metrics and technical indicators support a price rally?
Yes, the Money Flow Index has dropped to healthy bullish levels, and the mean coin age reflects BTC accumulation.
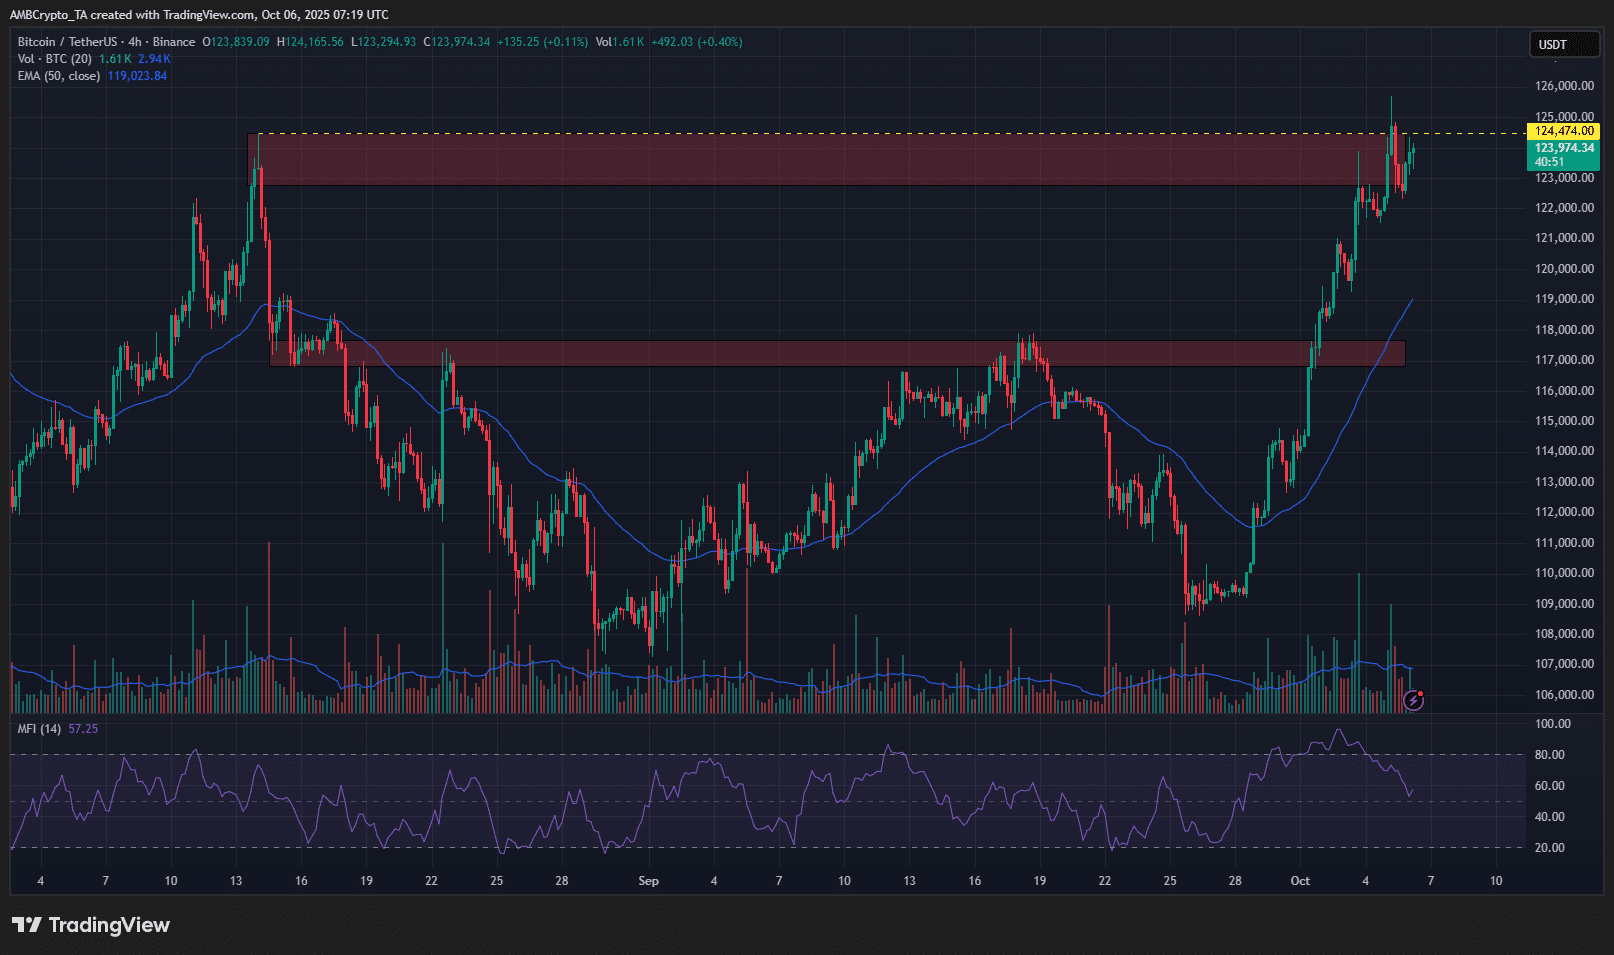
Bitcoin [BTC] made a new all-time high on Sunday, the 5th of October, reaching $125,599. Over the past 24 hours, it saw a slight pullback to $122.8k. At press time, it was trading at $123,974.
Source: BTC/USDT on TradingView
The 4-hour chart showed that the $124.5k level was a key local high in recent weeks. Sunday’s rally was brief, and this level was not defended as support.
However, it showed that the supply overhead was weakened.
In a post on X, crypto analyst Ali Martinez pointed out that the $117k level was an important demand zone. This claim was backed by the UTXO realized price distribution.
Another popular analyst, CrypNuevo, highlighted the potential for a pullback to the 4-hour 50-period simple moving average. At the time of writing, the H4 50SMA was at $119k.
The MFI, according to the H4 chart above, did not reflect overextended conditions. It has pulled back to healthy levels after moving beyond the overbought 80 mark on Sunday.
Will Bitcoin continue its rally this week, or should traders wait for a price dip?