
The BEAM price has fallen gradually since its all-time high of $0.027 on December 14, 2023.
Despite the decrease, the price regained footing in 2024 and broke out from a long-term pattern.
BEAM Attempts Breakout
The daily time frame chart shows that the BEAM price created a bullish hammer candlestick on January 3 (green icon), when it had fallen to a low of $0.012. The price has increased since.
After creating a higher low on January 14, BEAM accelerated its rate of increase, creating an ascending support trend line. Today, it is making its third bullish candlestick, breaking out from a horizontal resistance area that has been in place for nearly a month.
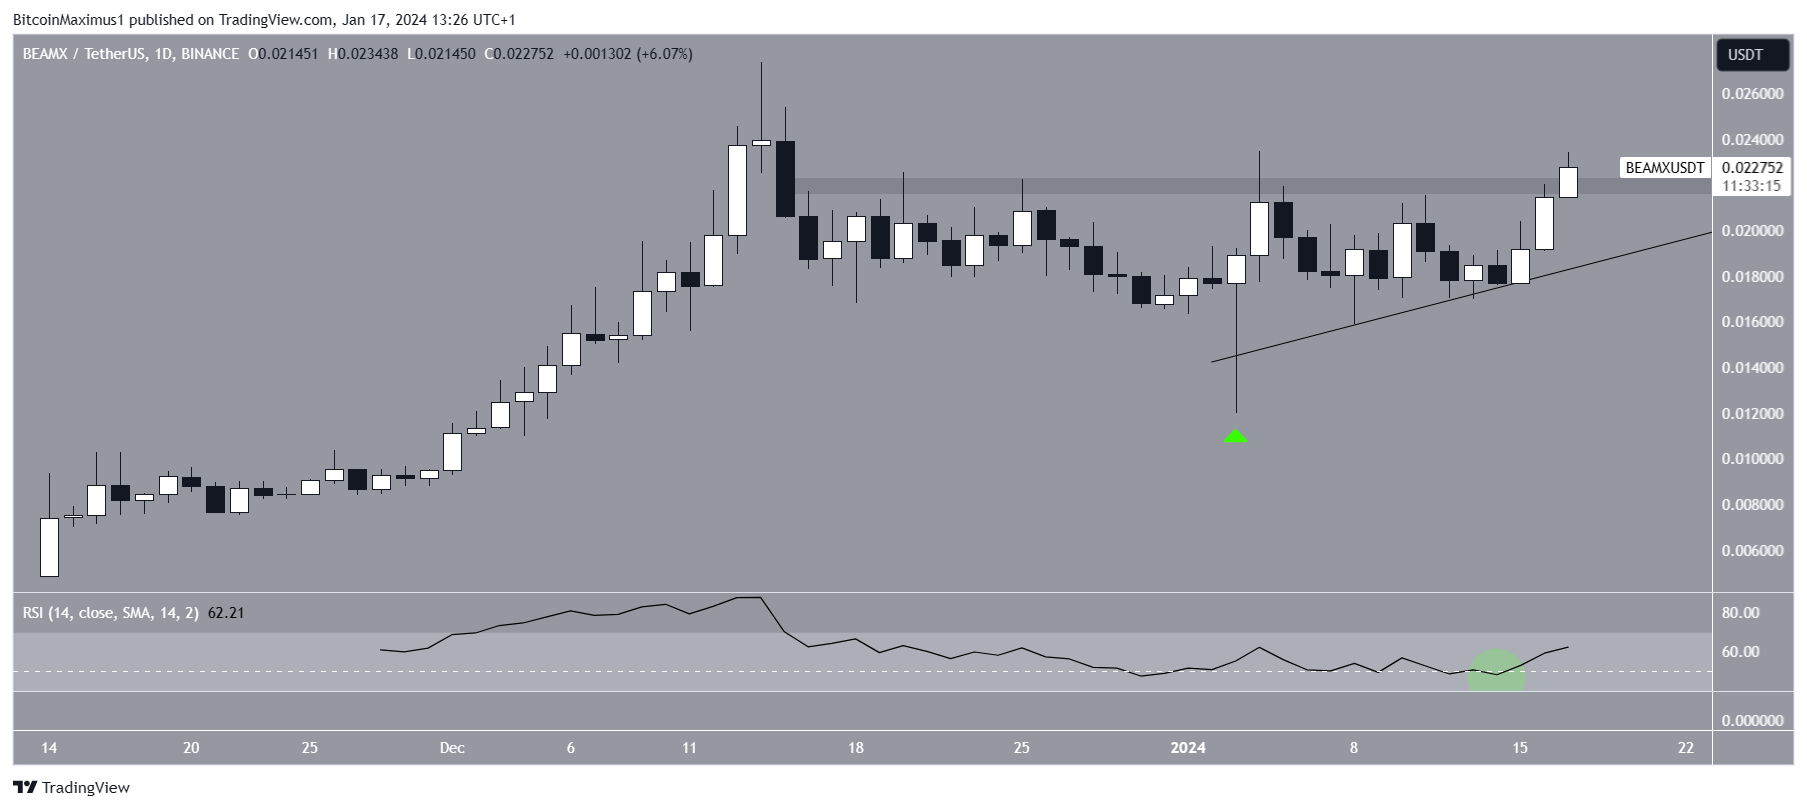
The daily RSI is also turning bullish.
The RSI is a momentum indicator traders use to evaluate whether a market is overbought or oversold and whether to accumulate or sell an asset.
Readings above 50 a
Go to Source to See Full Article
Author: Valdrin Tahiri
Tip BTC Newswire with Cryptocurrency
Donate Bitcoin to BTC Newswire

Donate Bitcoin Cash to BTC Newswire

Donate Ethereum to BTC Newswire

Donate Litecoin to BTC Newswire

Donate Monero to BTC Newswire

Donate ZCash to BTC Newswire


