Disclaimer: The information presented does not constitute financial, investment, trading, or other types of advice.
- Indicators pointed to a neutral market sentiment
- The $7.8-$8 support could be tested once again as support
Axie Infinity (AXS/USD) has seen significant price fluctuations over the past year, trading at $58 on 1 March 2022, $6.2 on 1 January 2023, and $9.8 on 1 March 2023. At press time, AXS/USD was valued at $8.38 after gaining by 3.6% in the last 24 hours.
Is your portfolio green? Check the Axie Infinity Profit Calculator
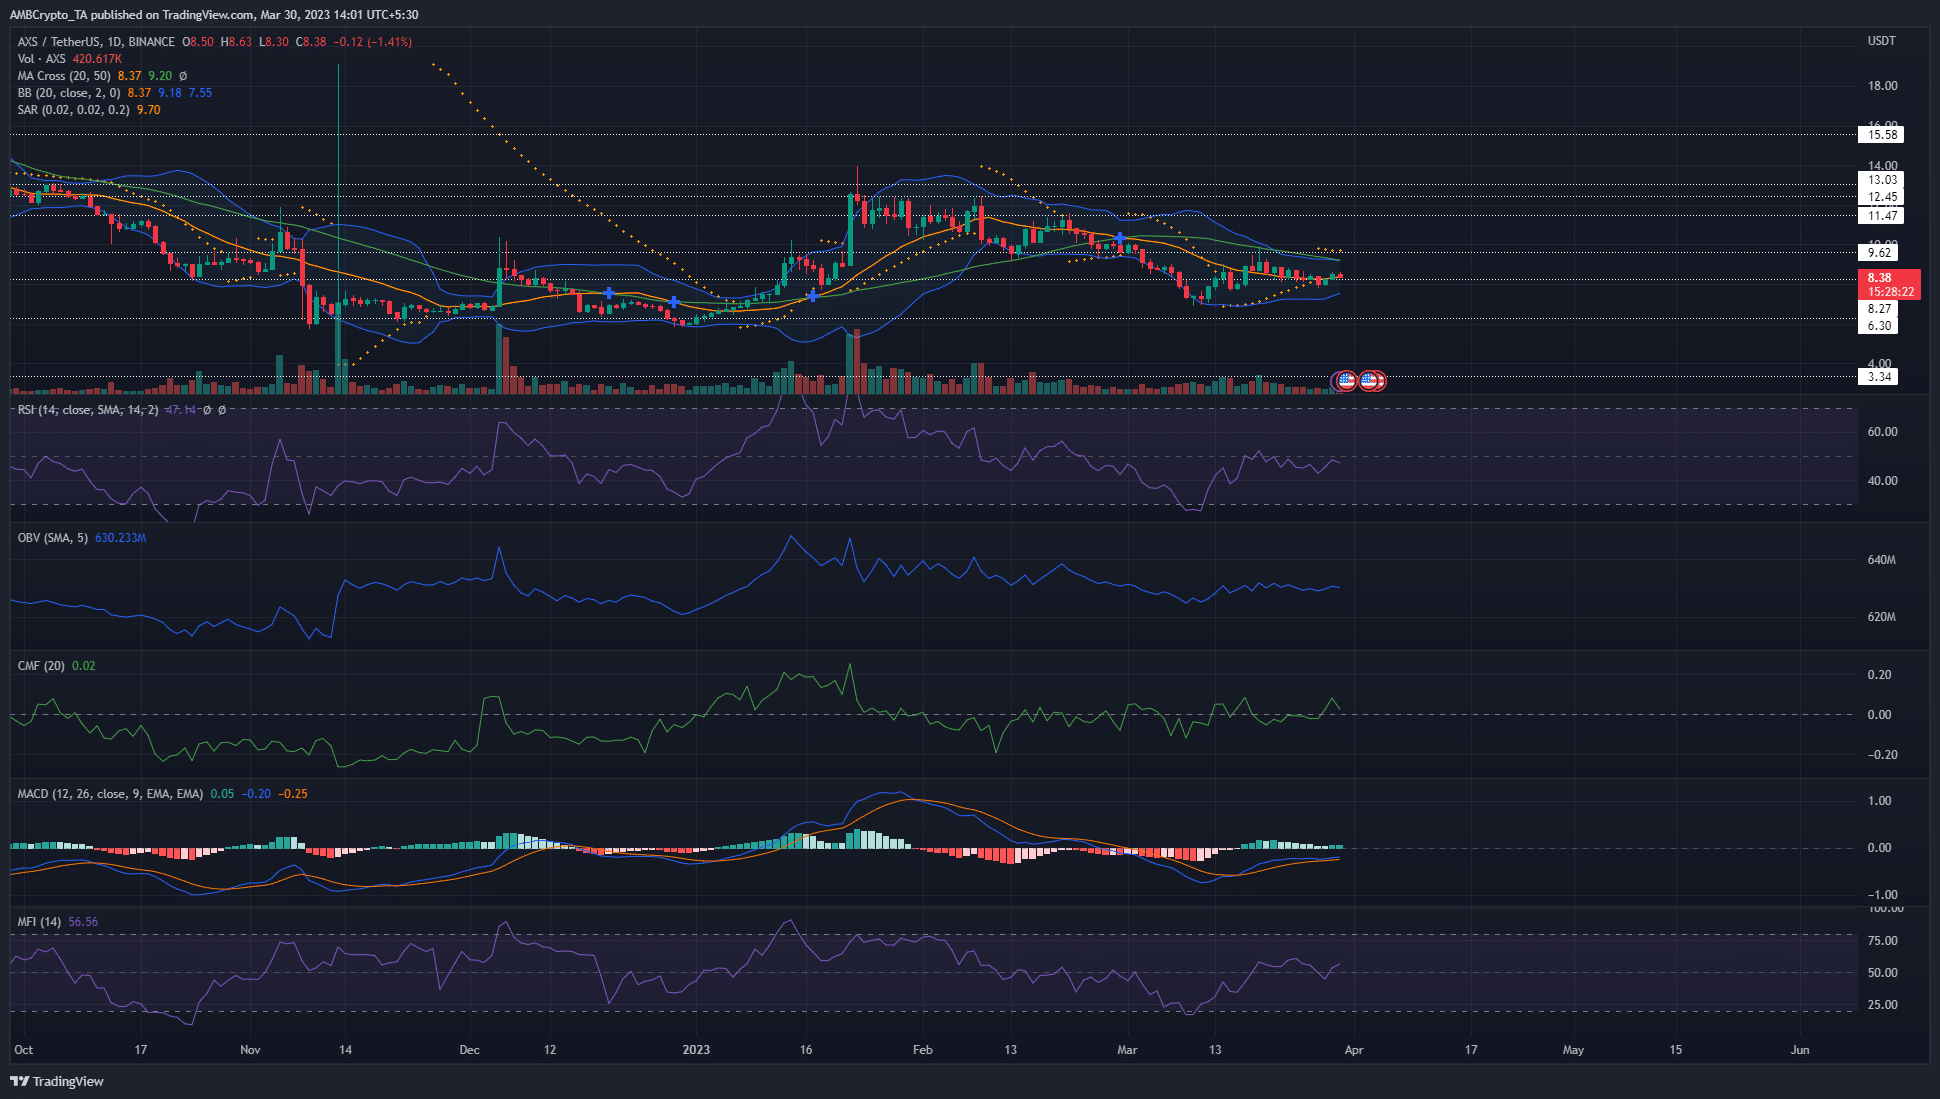
This analysis will examine key technical indicators on the 1-day timeframe, including the Relative Strength Index (RSI), Bollinger Bands, On-Balance Volume (OBV), Chaikin Money Flow (CMF), Moving Averages, MACD, Money Flow Index (MFI), and Parabolic SAR.
Bears could take control of the market if prices fall below $7.8
AXS is a crypto-token positively correlated with Bitcoin (BTC) on the price charts. With Bitcoin facing strong resistance at $28.7K, AXS could see a pullback. The market sentiment has been bullish in March, but there’s a possibility of a correction south for both BTC and AXS.
Key Highlights –
- RSI at 47.25, suggesting a neutral market sentiment
- Bollinger Bands converging, indicating a potential price breakout
- OBV at 630M, flat for the past two weeks
- CMF at +0.03, indicating mild buying pressure
- Moving Averages: 20 SMA at 8.37, 50 SMA at 9.2
- MACD below zero line but formed a bullish crossover, with values at -0.2 and -0.25
- MFI at 57.6, pointing to a balanced market
- Parabolic SAR’s dots above price candles, signalling a short-term bearish trend
Considering the technical indicators, AXS/USD faces potential challenges with the 20 and 50 SMA levels acting as resistance. However, the bullish MACD crossover hinted at a possible trend reversal. The converging Bollinger Bands h
Go to Source to See Full Article
Author: Akashnath S
Tip BTC Newswire with Cryptocurrency
Donate Bitcoin to BTC Newswire

Donate Bitcoin Cash to BTC Newswire

Donate Ethereum to BTC Newswire

Donate Litecoin to BTC Newswire

Donate Monero to BTC Newswire

Donate ZCash to BTC Newswire


