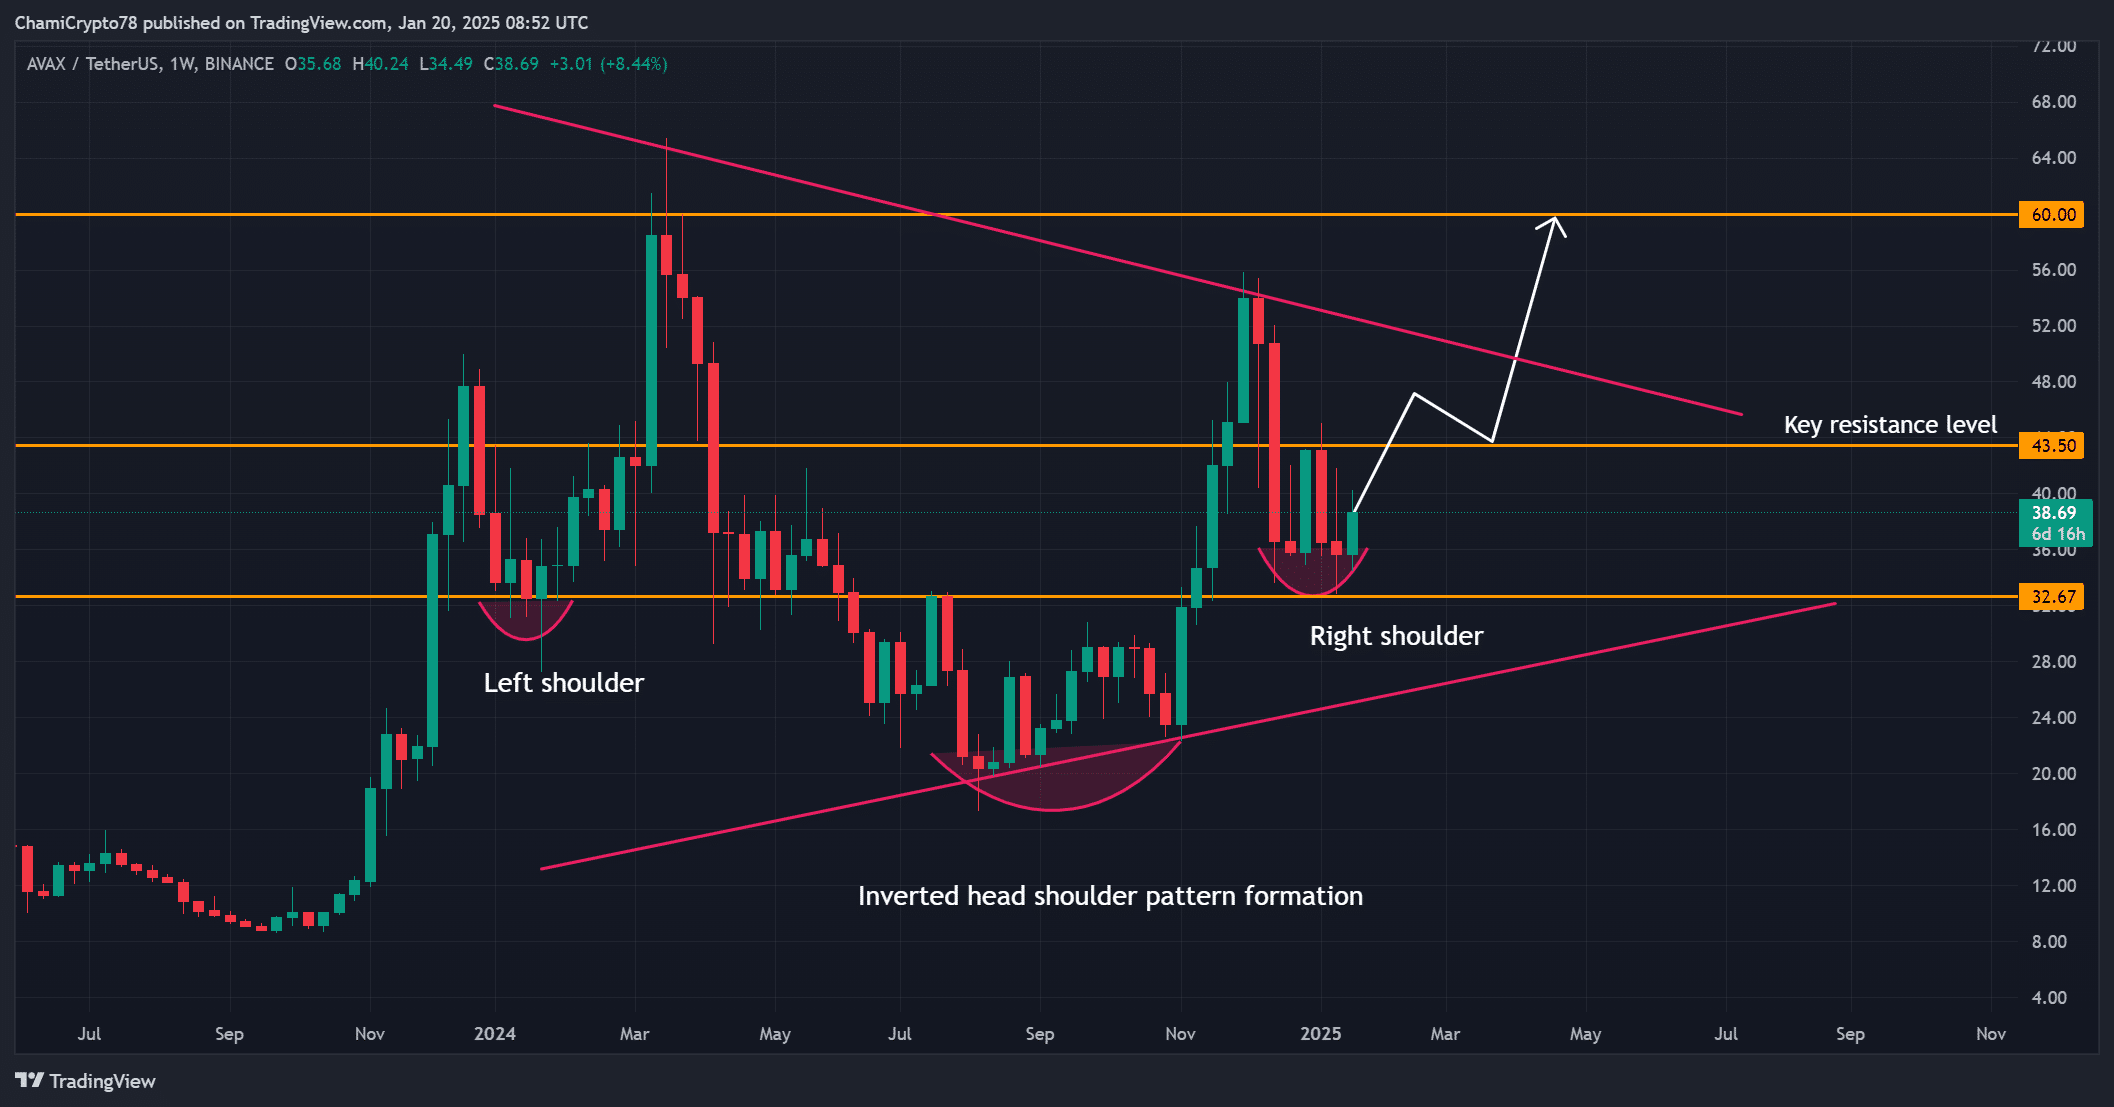
- AVAX formed a bullish pattern, with $43.50 and $60 as key resistance levels.
- Market indicators showed strong momentum, supported by rising Open Interest and trader activity.
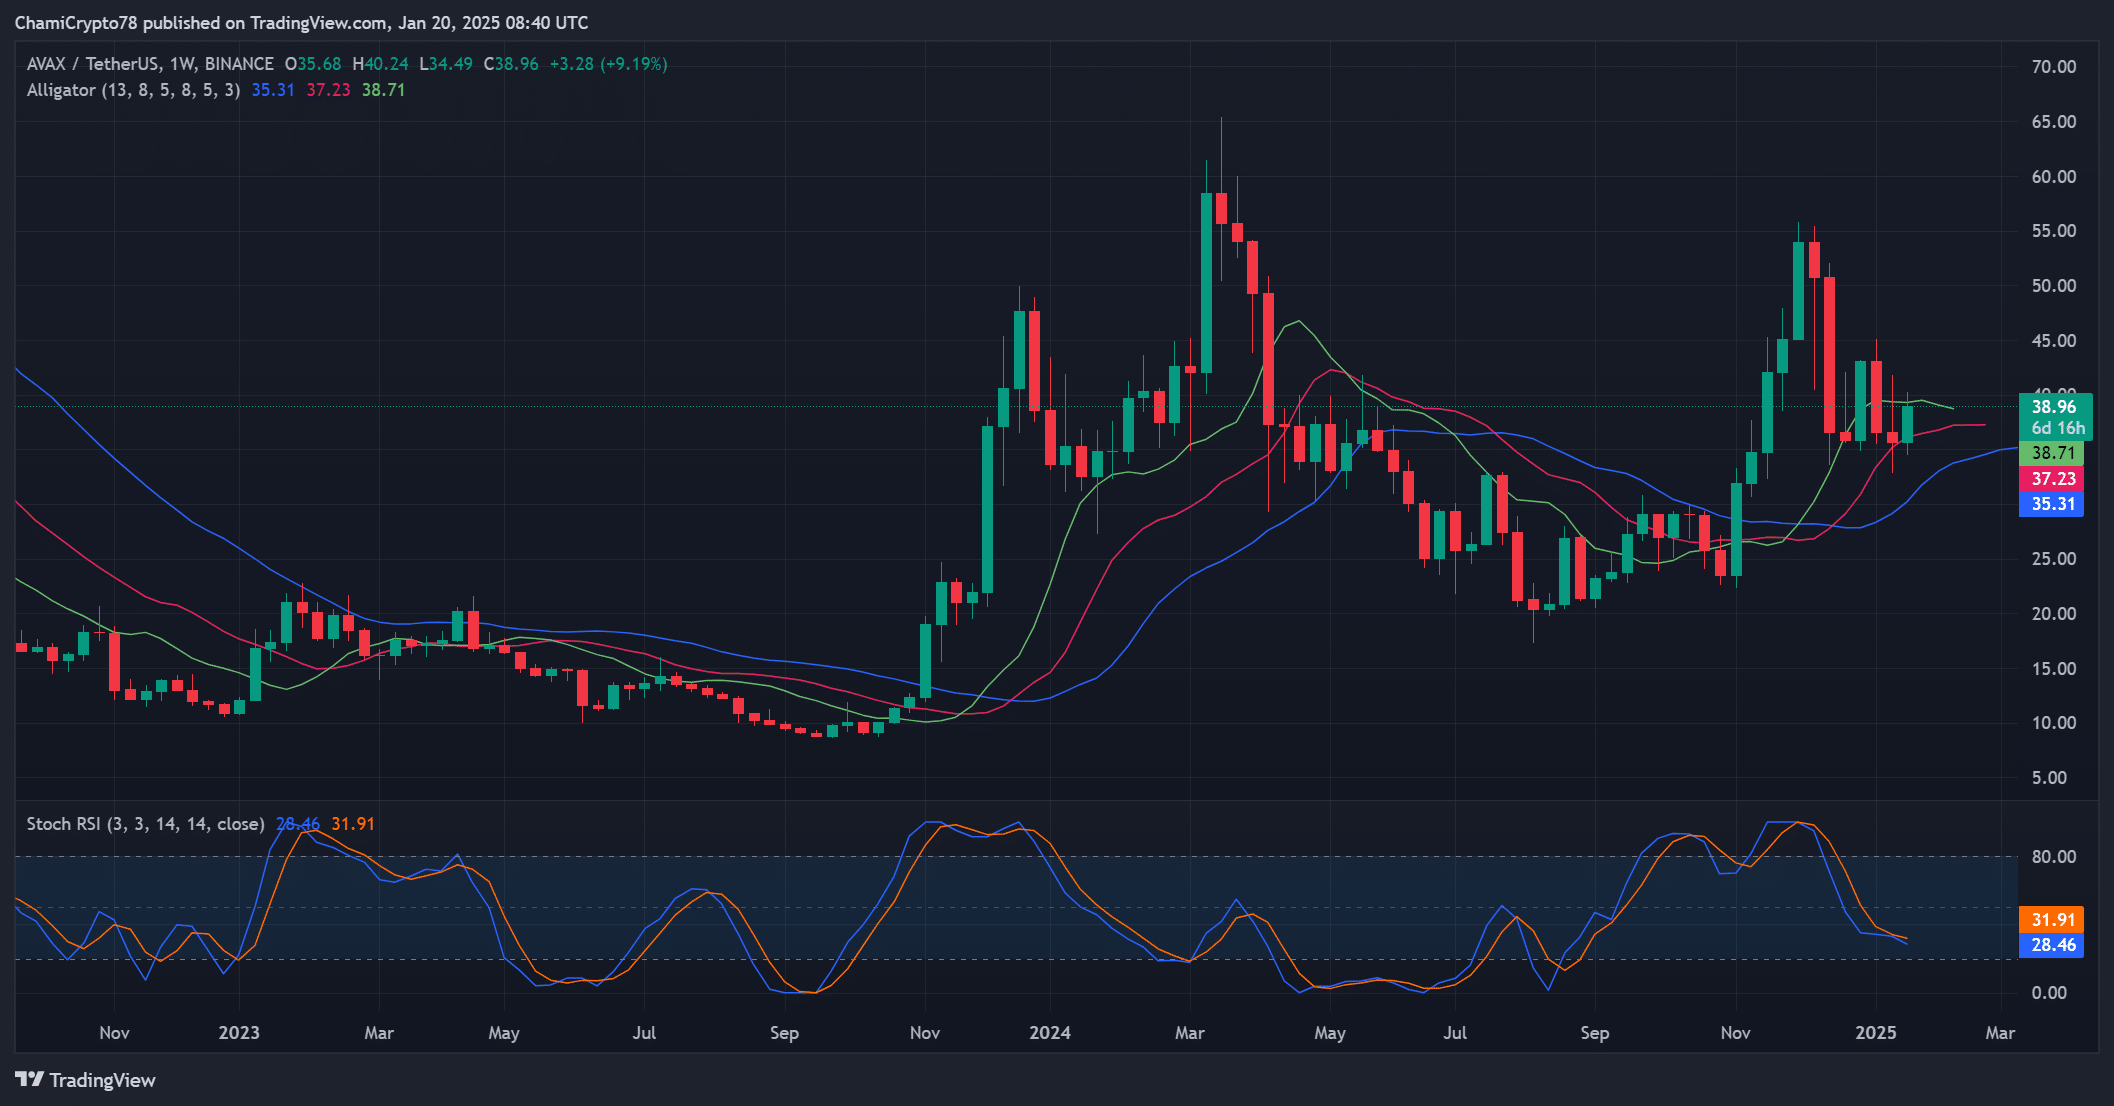
Avalanche [AVAX] is making waves as it consolidates within a symmetrical triangle, a classic bullish pattern that often precedes explosive moves. Trading at $38.98, up 2.98% at press time, AVAX is showing signs of a potential rally.
With strong support at the 50-week moving average and bullish sentiment gaining traction, traders are closely watching for the next big move. The question remains: can AVAX surpass key resistance levels and push higher?
Is AVAX ready for a price breakout?
AVAX’s price action suggests an upward breakout could be imminent due to its inverted head-and-shoulders pattern. This formation, with its head at $32.67 and shoulders on either side, signals strong bullish potential.
Resistance at $43.50 is the next key barrier, followed by $60, a critical target for bulls. The symmetrical triangle structure also supports this bullish outlook.
However, failure to hold above $43.50 could disrupt this momentum, making these levels crucial for traders to monitor.
Source: TradingView
What do technical indicators reveal?
Technical indicators provide additional evidence supporting the bullish case for AVAX. The Stochastic RSI stands at 31.91, indicating oversold conditions and suggesting a rebound could be around the corner.
Additionally, the Williams Alligator lines (35.31, 37.23, 38.71) are narrowing, signaling consolidation. As these lines begin to diverge, a breakout could gain momentum.
These indicators underscore the importance of upcoming price movements, with both resistance and support levels playing a pivotal role.