- Analysts predicted a 46% surge for Arbitrum if it breaks the $0.78 resistance within the descending triangle.
- On-chain data showed bearish sentiment, but traders target $1.0690 if bullish momentum returns.
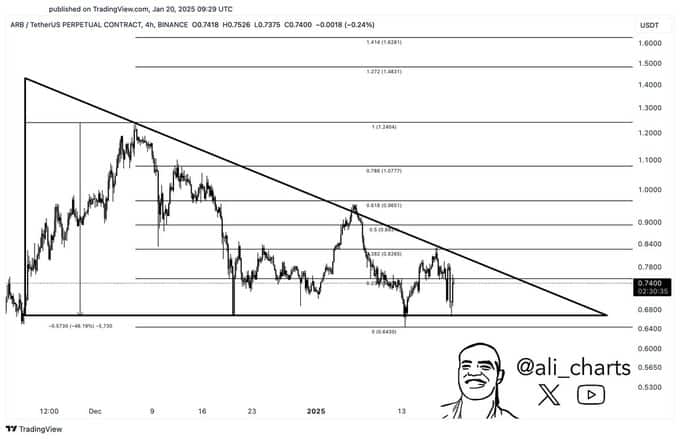
Arbitrum [ARB] was trading within a classic descending triangle pattern, a structure often associated with potential breakout opportunities.
Analysts suggest a breakout could lead to a 46% price rally, placing the spotlight on ARB’s next move. With the price currently consolidating near key support levels, traders are watching for critical price reactions.
At the time of writing, ARB was trading at $0.7066, with a 24-hour trading volume of $606,785,204, reflecting a 3.51% decline in the past day.
ARB has also experienced a 7-day decline of 3.24%, and its market cap is currently valued at $3.05 billion, with a circulating supply of 4.3 billion ARB tokens.
Key support and resistance levels
The ARB/USDT chart indicates bearish pressure, with the price consolidating near the $0.6890 support level, which is critical for stability.
Failure to hold above this level could drive prices lower, potentially testing $0.6500, a psychological support level.
Immediate resistance is noted at $0.78, where the descending trendline has rejected price movements multiple times.
Fibonacci retracement levels at $0.8661 (0.618) and $0.9077 (0.786) represent key hurdles if ARB attempts an upward move.
According to analysts, a decisive breakout above these levels could pave the way for a
Go to Source to See Full Article
Author: Olivia Stephanie