Disclaimer: The information presented does not constitute financial, investment, trading, or other types of advice and is solely the writer’s opinion.
- The 4-hour chart showed momentum and structure were weakly in favor of bears.
- The disagreement from the CVD gave rise to the idea that APT bulls could be gearing up for a move upward.
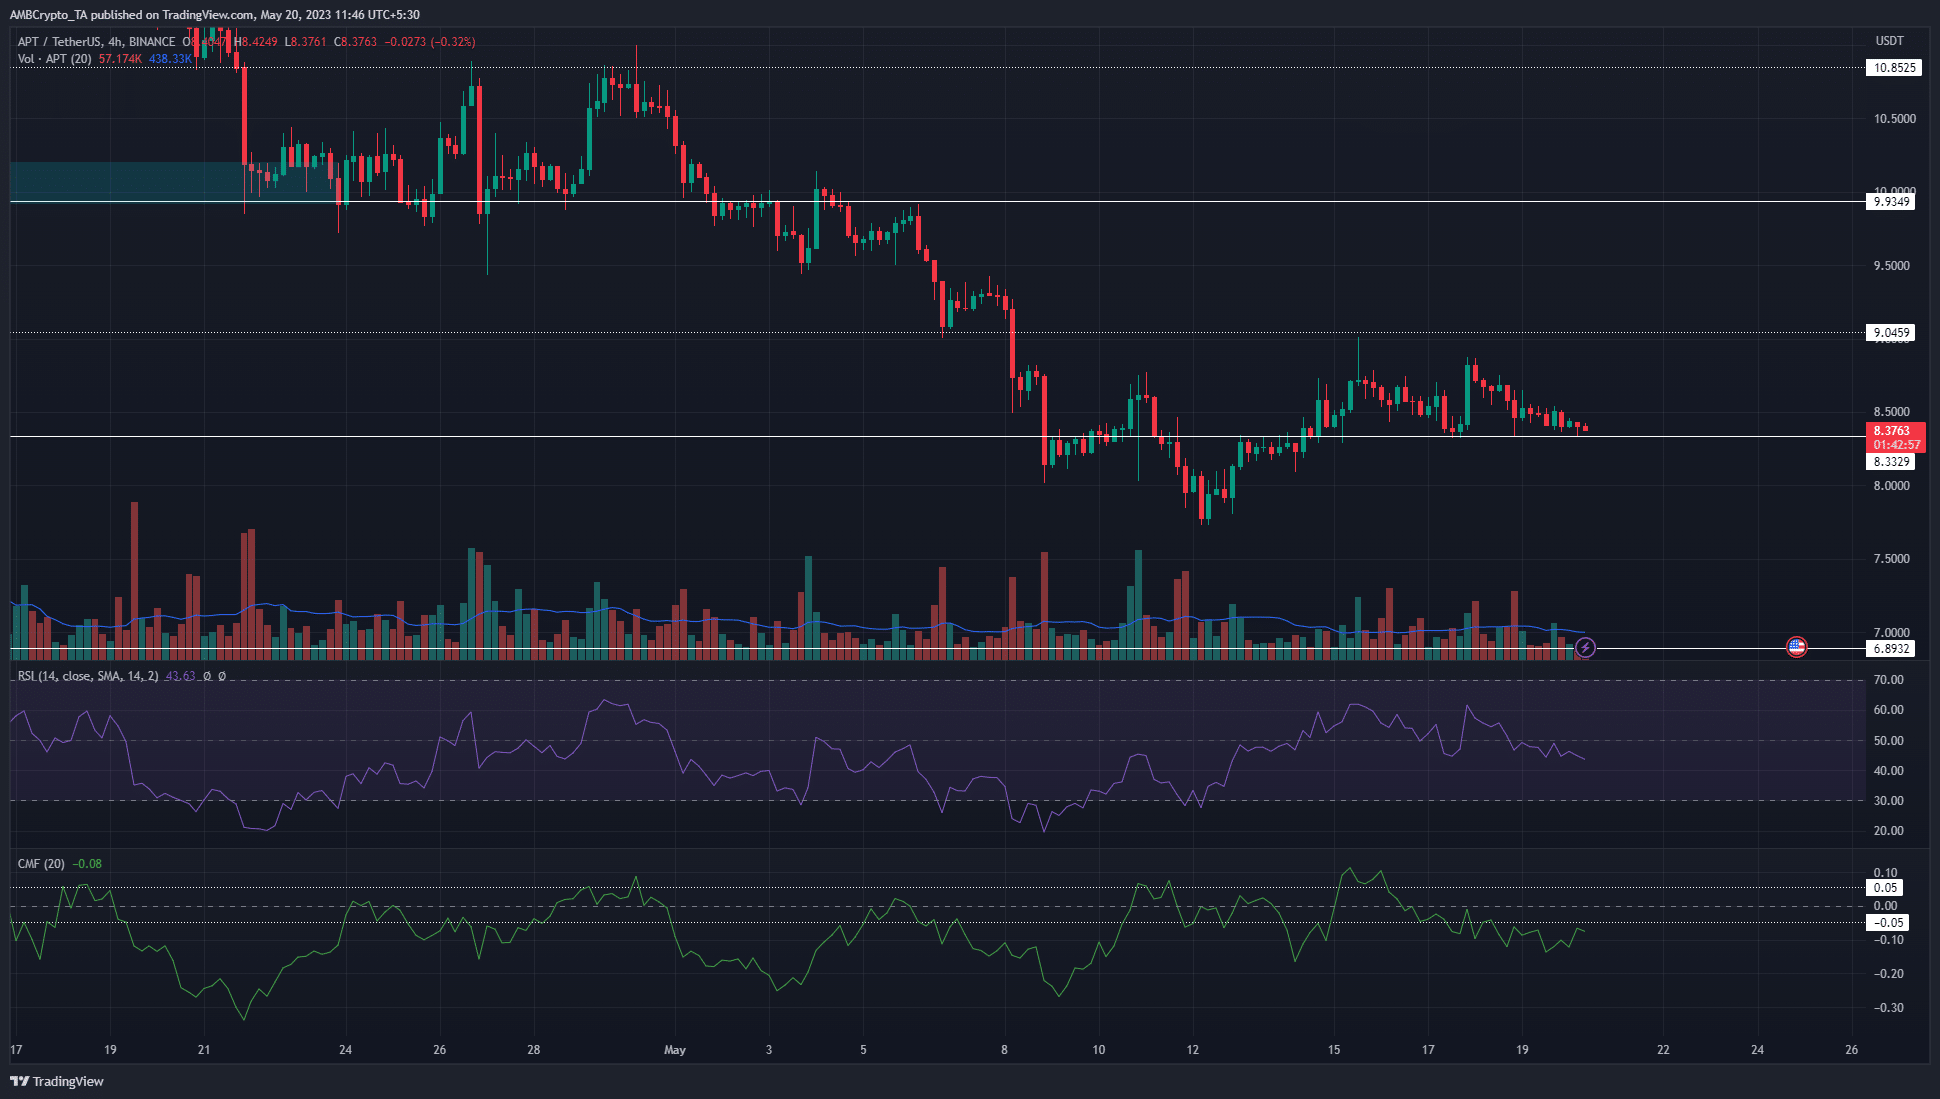
Aptos [APT] has been in a steady downtrend since late January, following its rapid move from $3.85 to $20 within the first month of 2023. When writing, the prices were perched atop a support level of $8.33.
Read Aptos’s [APT] Price Prediction 2023-24
Although a bounce in APT prices was possible, a reversal of the downtrend might not be in sight given the sentiment across the crypto market. Beneath $8.3, $7.75 and $6.9 were levels of support to watch out for.
Aptos bulls manage to defend $8.33 but an uptrend was not yet in sight
On the 4-hour chart, the market structure of APT remained bearish. The lower high at $8.82 registered on 8 May was still not broken (trading session close above), although it came extremely close on 17 May.
On lower timeframes, the formation of higher lows since 14 May was a slightly encouraging factor.
The higher timeframes also heavily leaned in favor of the bulls. The daily timeframe showed the market structure was strongly bearish. The temporary stall in momentum at the $8.2-$8.33 area might not mean the downtrend was about to reverse.
How much are 1, 10, or 100 APT worth today?
The RSI on H4 was at 44 and fell below neutral 50 on 18 May. This showed bearish momentum was beginning to take hold, but was not significant yet. The CMF was below -0.05 in recent days, which highlighted large amounts of capital flowing out of the market
Go to Source to See Full Article
Author: Akashnath S
Tip BTC Newswire with Cryptocurrency
Donate Bitcoin to BTC Newswire

Donate Bitcoin Cash to BTC Newswire

Donate Ethereum to BTC Newswire

Donate Litecoin to BTC Newswire

Donate Monero to BTC Newswire

Donate ZCash to BTC Newswire


