Disclaimer: The information presented does not constitute financial, investment, trading, or other types of advice and is solely the writer’s opinion.
- The market structure of Aptos was bullish on the 4-hour chart once more.
- The break in structure was followed by a swift surge which showed bullish intent was strong.
Aptos [APT] registered an important development on the price chart today. It broke past the $8 mark, which was both a psychological resistance as well as the previous lower high from 23 June. Combined with the lower timeframe bullishness, it appeared likely that APT could see strong gains in July.
Read Aptos’ [APT] Price Prediction 2023-24
However, the $8-$8.6 region represented a strong resistance zone on the daily timeframe. The $8-$8.36 was also a bearish order block on the 4-hour chart. Can APT bulls manage to breach this confluence of resistances?
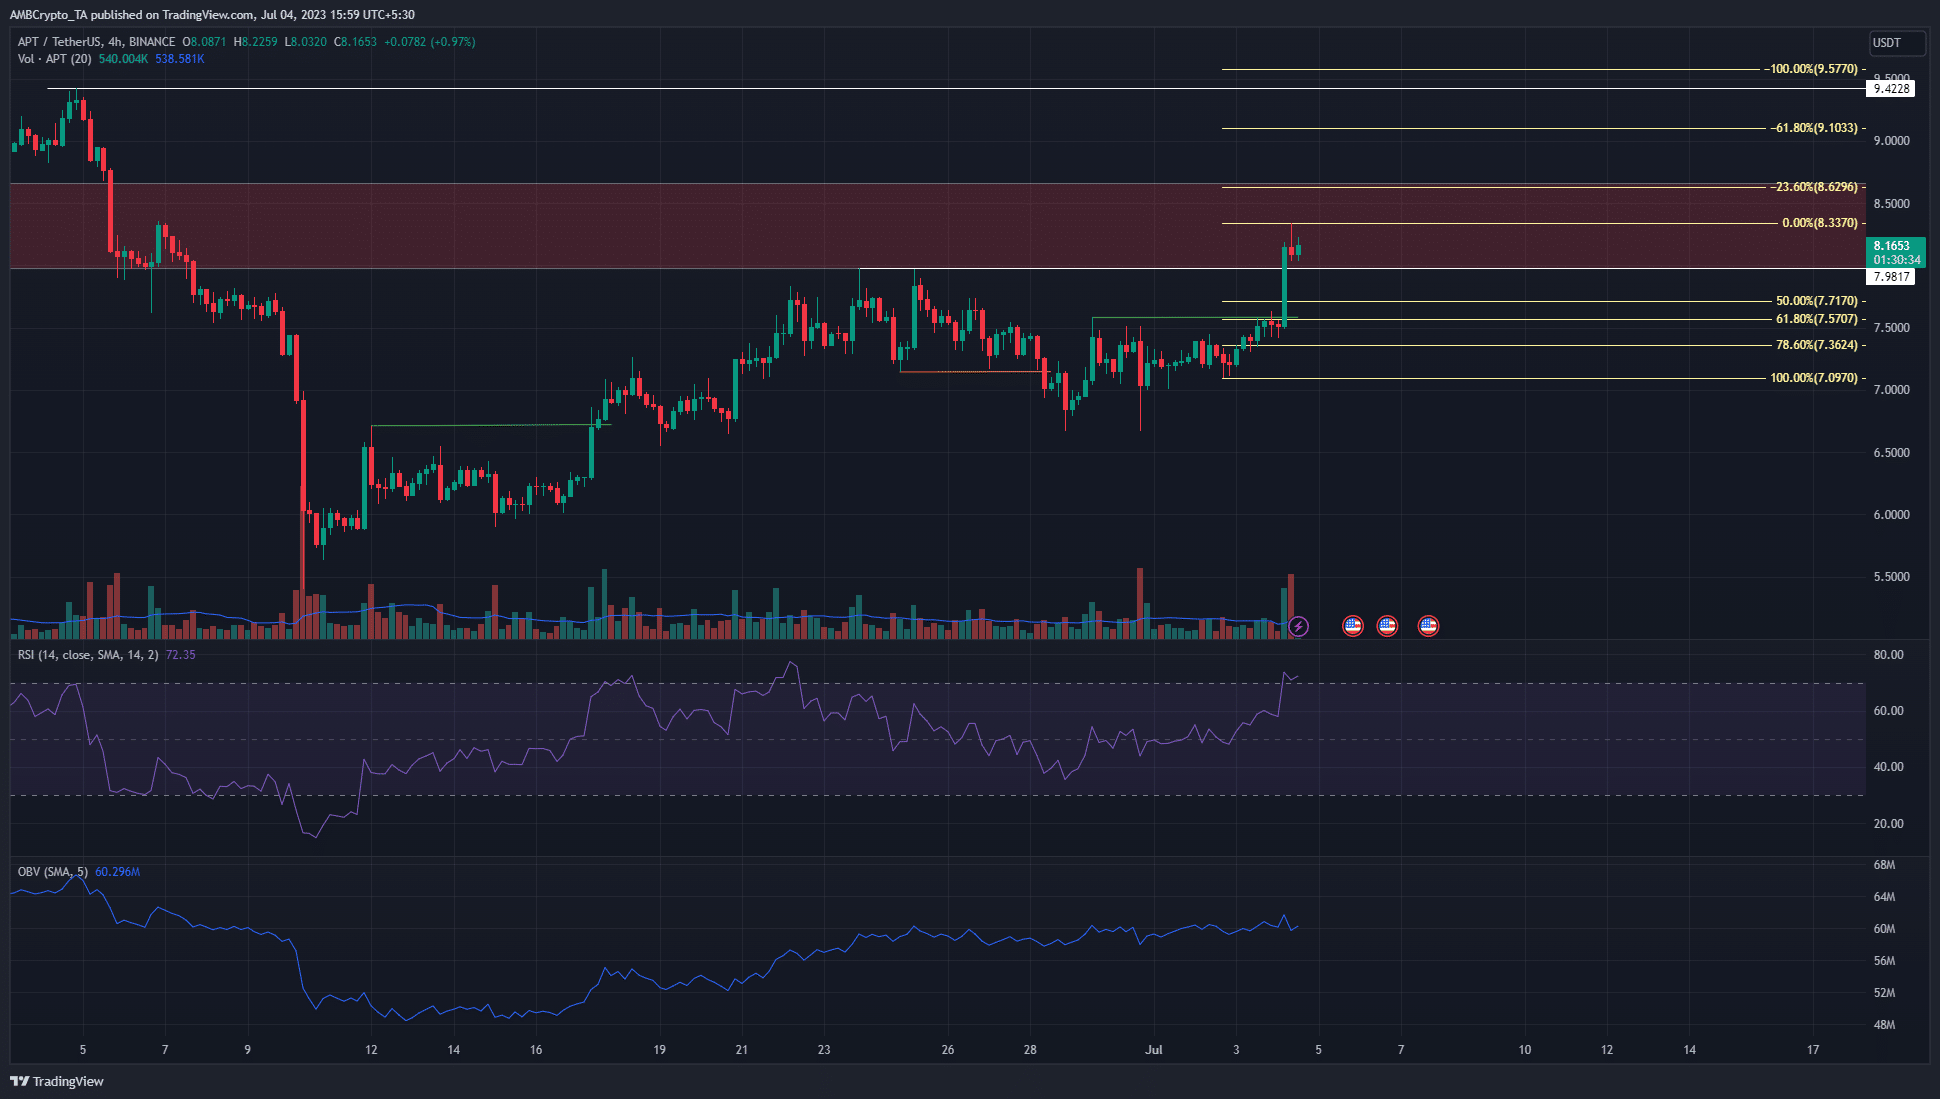
Aptos bulls break the structure to bullish and pump prices into a zone of resistance
The bullish breaks are highlighted by the green lines, and the bearish ones by the orange line. The highlight is that APT bulls did not look back after flipping the market structure bullish. Instead, they pushed prices straight up.
The price registered gains of 9.3% within a single 4-hour trading session. A few hours before the time of writing, APT appeared to stall at the $8.33 level. Hence it was used to plot a set of Fibonacci retracement levels. However, if Aptos chooses to rally higher, the plot must be revised.
Based on the evidence at hand, buyers of APT can look for opportunities upon a retest of the 50% or 61.8% retracement levels. They lie at $7.717 and $7.57, and the latter was where the market structure flipped bullishly.
Considering the imbalance left due to the strong surge from $7.57 to $8.15, a revisit of this zone could be worth
Go to Source to See Full Article
Author: Akashnath S
Tip BTC Newswire with Cryptocurrency
Donate Bitcoin to BTC Newswire

Donate Bitcoin Cash to BTC Newswire

Donate Ethereum to BTC Newswire

Donate Litecoin to BTC Newswire

Donate Monero to BTC Newswire

Donate ZCash to BTC Newswire


