Key Takeaways
What’s driving Aptos’ recent 11% price surge?
Strong bullish sentiment, rising derivatives activity, and increasing trading volume are fueling the rally.
Could APT break past the $4 level soon?
Technical indicators like Bollinger Bands, MFI, and AD suggest a potential breakout if buying momentum continues.
Aptos [APT] has recorded decent gains in the past 24 hours, pushing the asset’s price up by nearly 11%, at press time.
This bullish sentiment appears to be building further, with broader market targets still visible on the horizon.
Derivative bets are heavy on APT
Derivative investors continue to dominate activity in the APT market. According to CoinGlass, Open Interest has climbed to $275 million, reflecting a significant amount of liquidity in derivatives.
Although this alone doesn’t confirm a bullish trend, liquidation data offers more insight: in recent days, most losses have come from traders holding short positions, those betting against the rally.
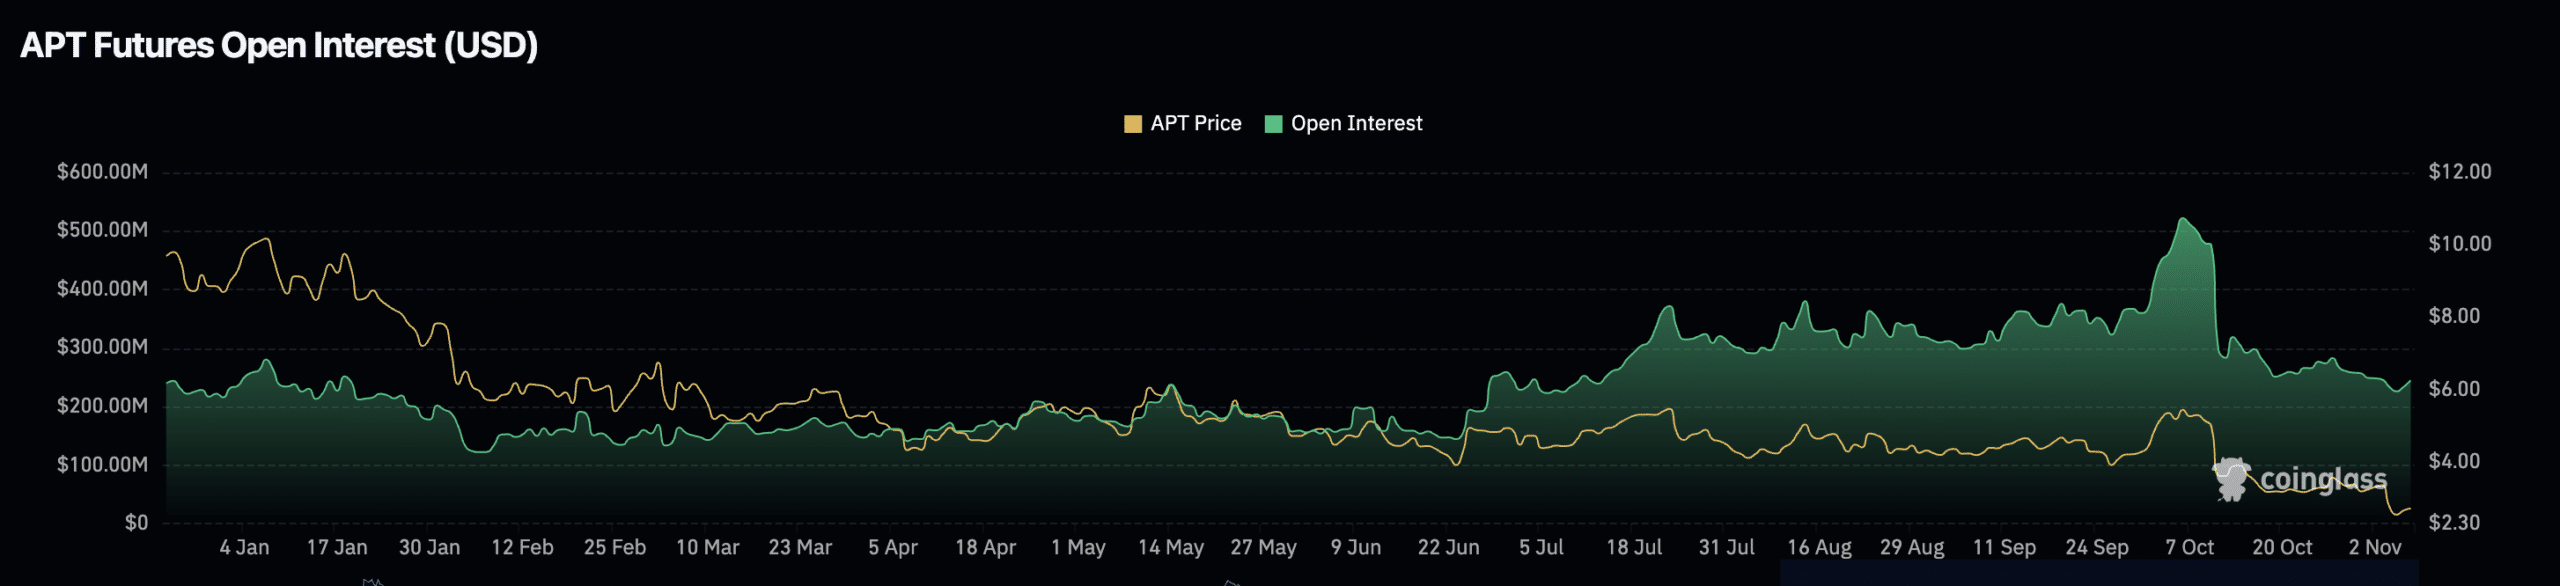
Source: CoinGlass
At the time of writing, $445,950 worth of short positions were liquidated, while long traders continue to maintain their bullish stance.
This could imply that the recent inflows of capital into APT are largely from bullish investors, especially considering the current skepticism around shorting the asset.
Technical setup adds to bullish outlook
Chart analysis indicates that another upward move could be the next likely scenario for APT as bullish momentum continues to strengthen.
The Bollinger Bands (BB) show that the price is trading near the lower band marked in green, which has often catalyzed upward movement.
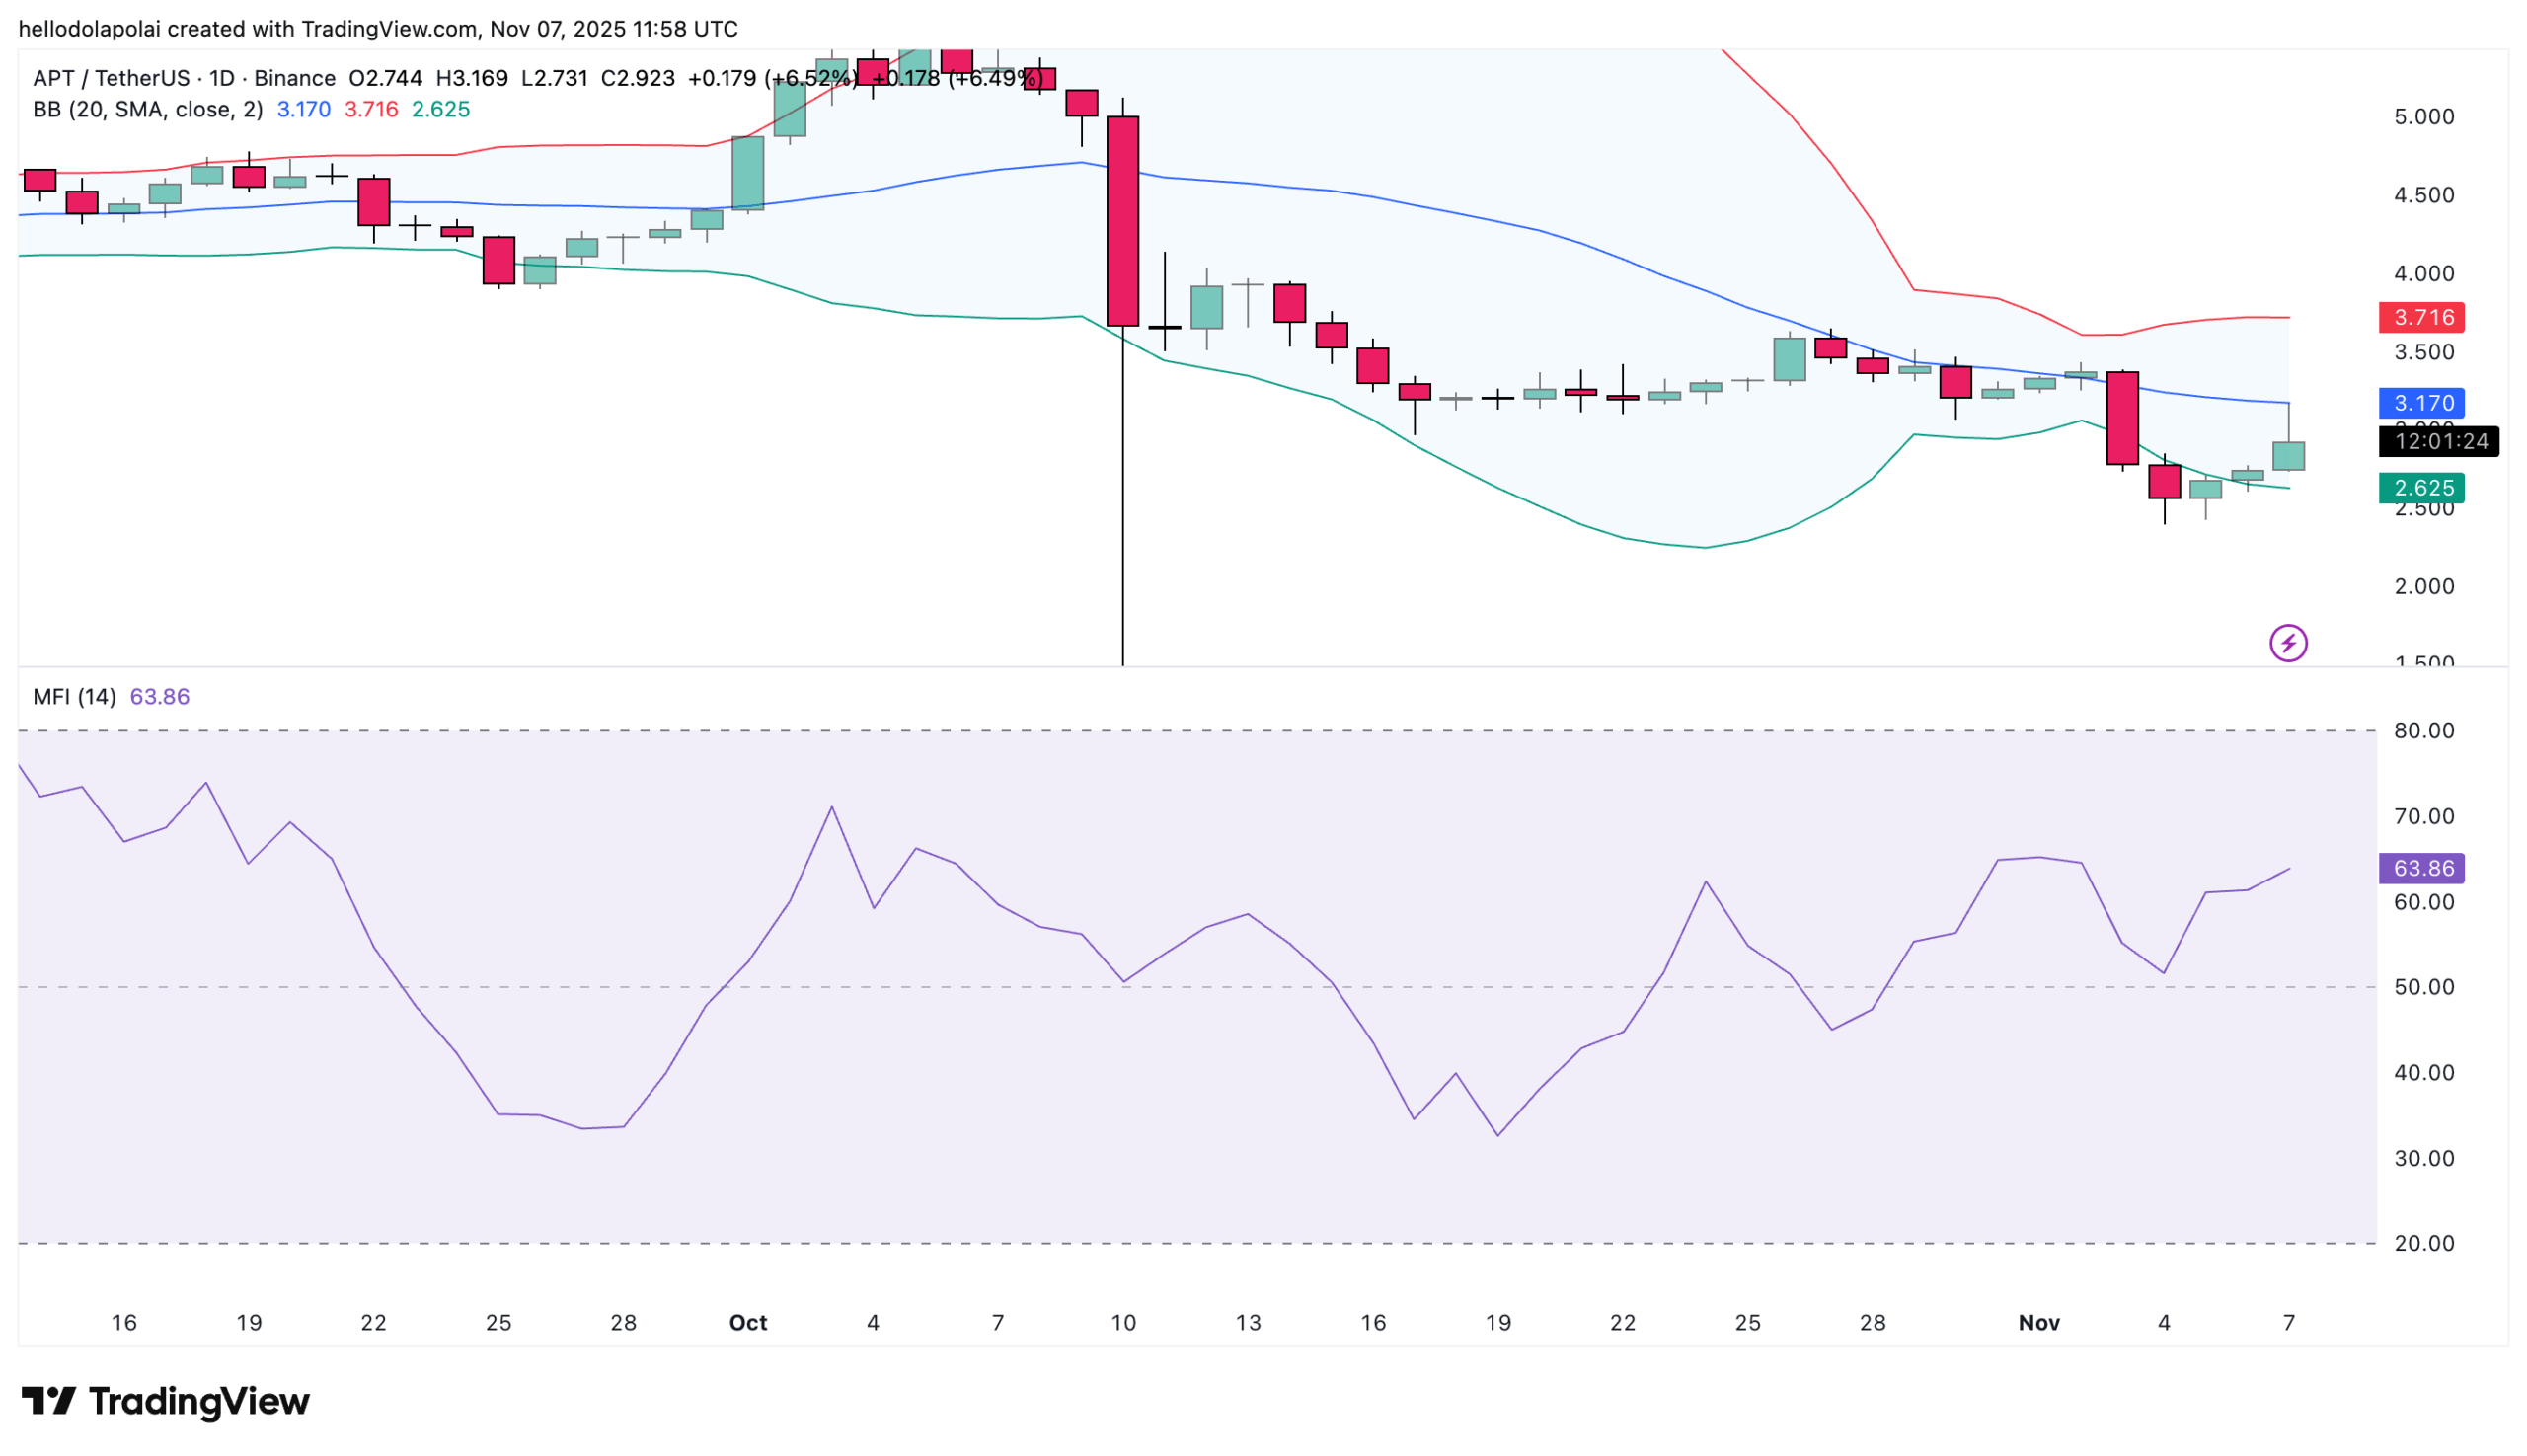
Source: TradingView
From this level, the price is expected to trend toward the upper band, marked in red, currently aligning with the $4 price level.
Supporting this outlook is the Money Flow Index (MFI), which remains in positive territory and shows a close correlation with upward price trends.
The MFI has stayed relatively flat, suggesting that capital continues to enter the market. An uptick from this level would likely add more strength to APT’s ongoing momentum.
Volume hits new highs
Trading volume in the APT market has continued to rise significantly, with cumulative volume reaching 183.74 million APT in recent sessions.
The Accumulation/Distribution (AD) indicator is trending higher in the positive region, suggesting that buying activity continues to dominate.
Historically, when this indicator trends positively, it indicates strong market accumulation and increases the likelihood of a sustained rally.
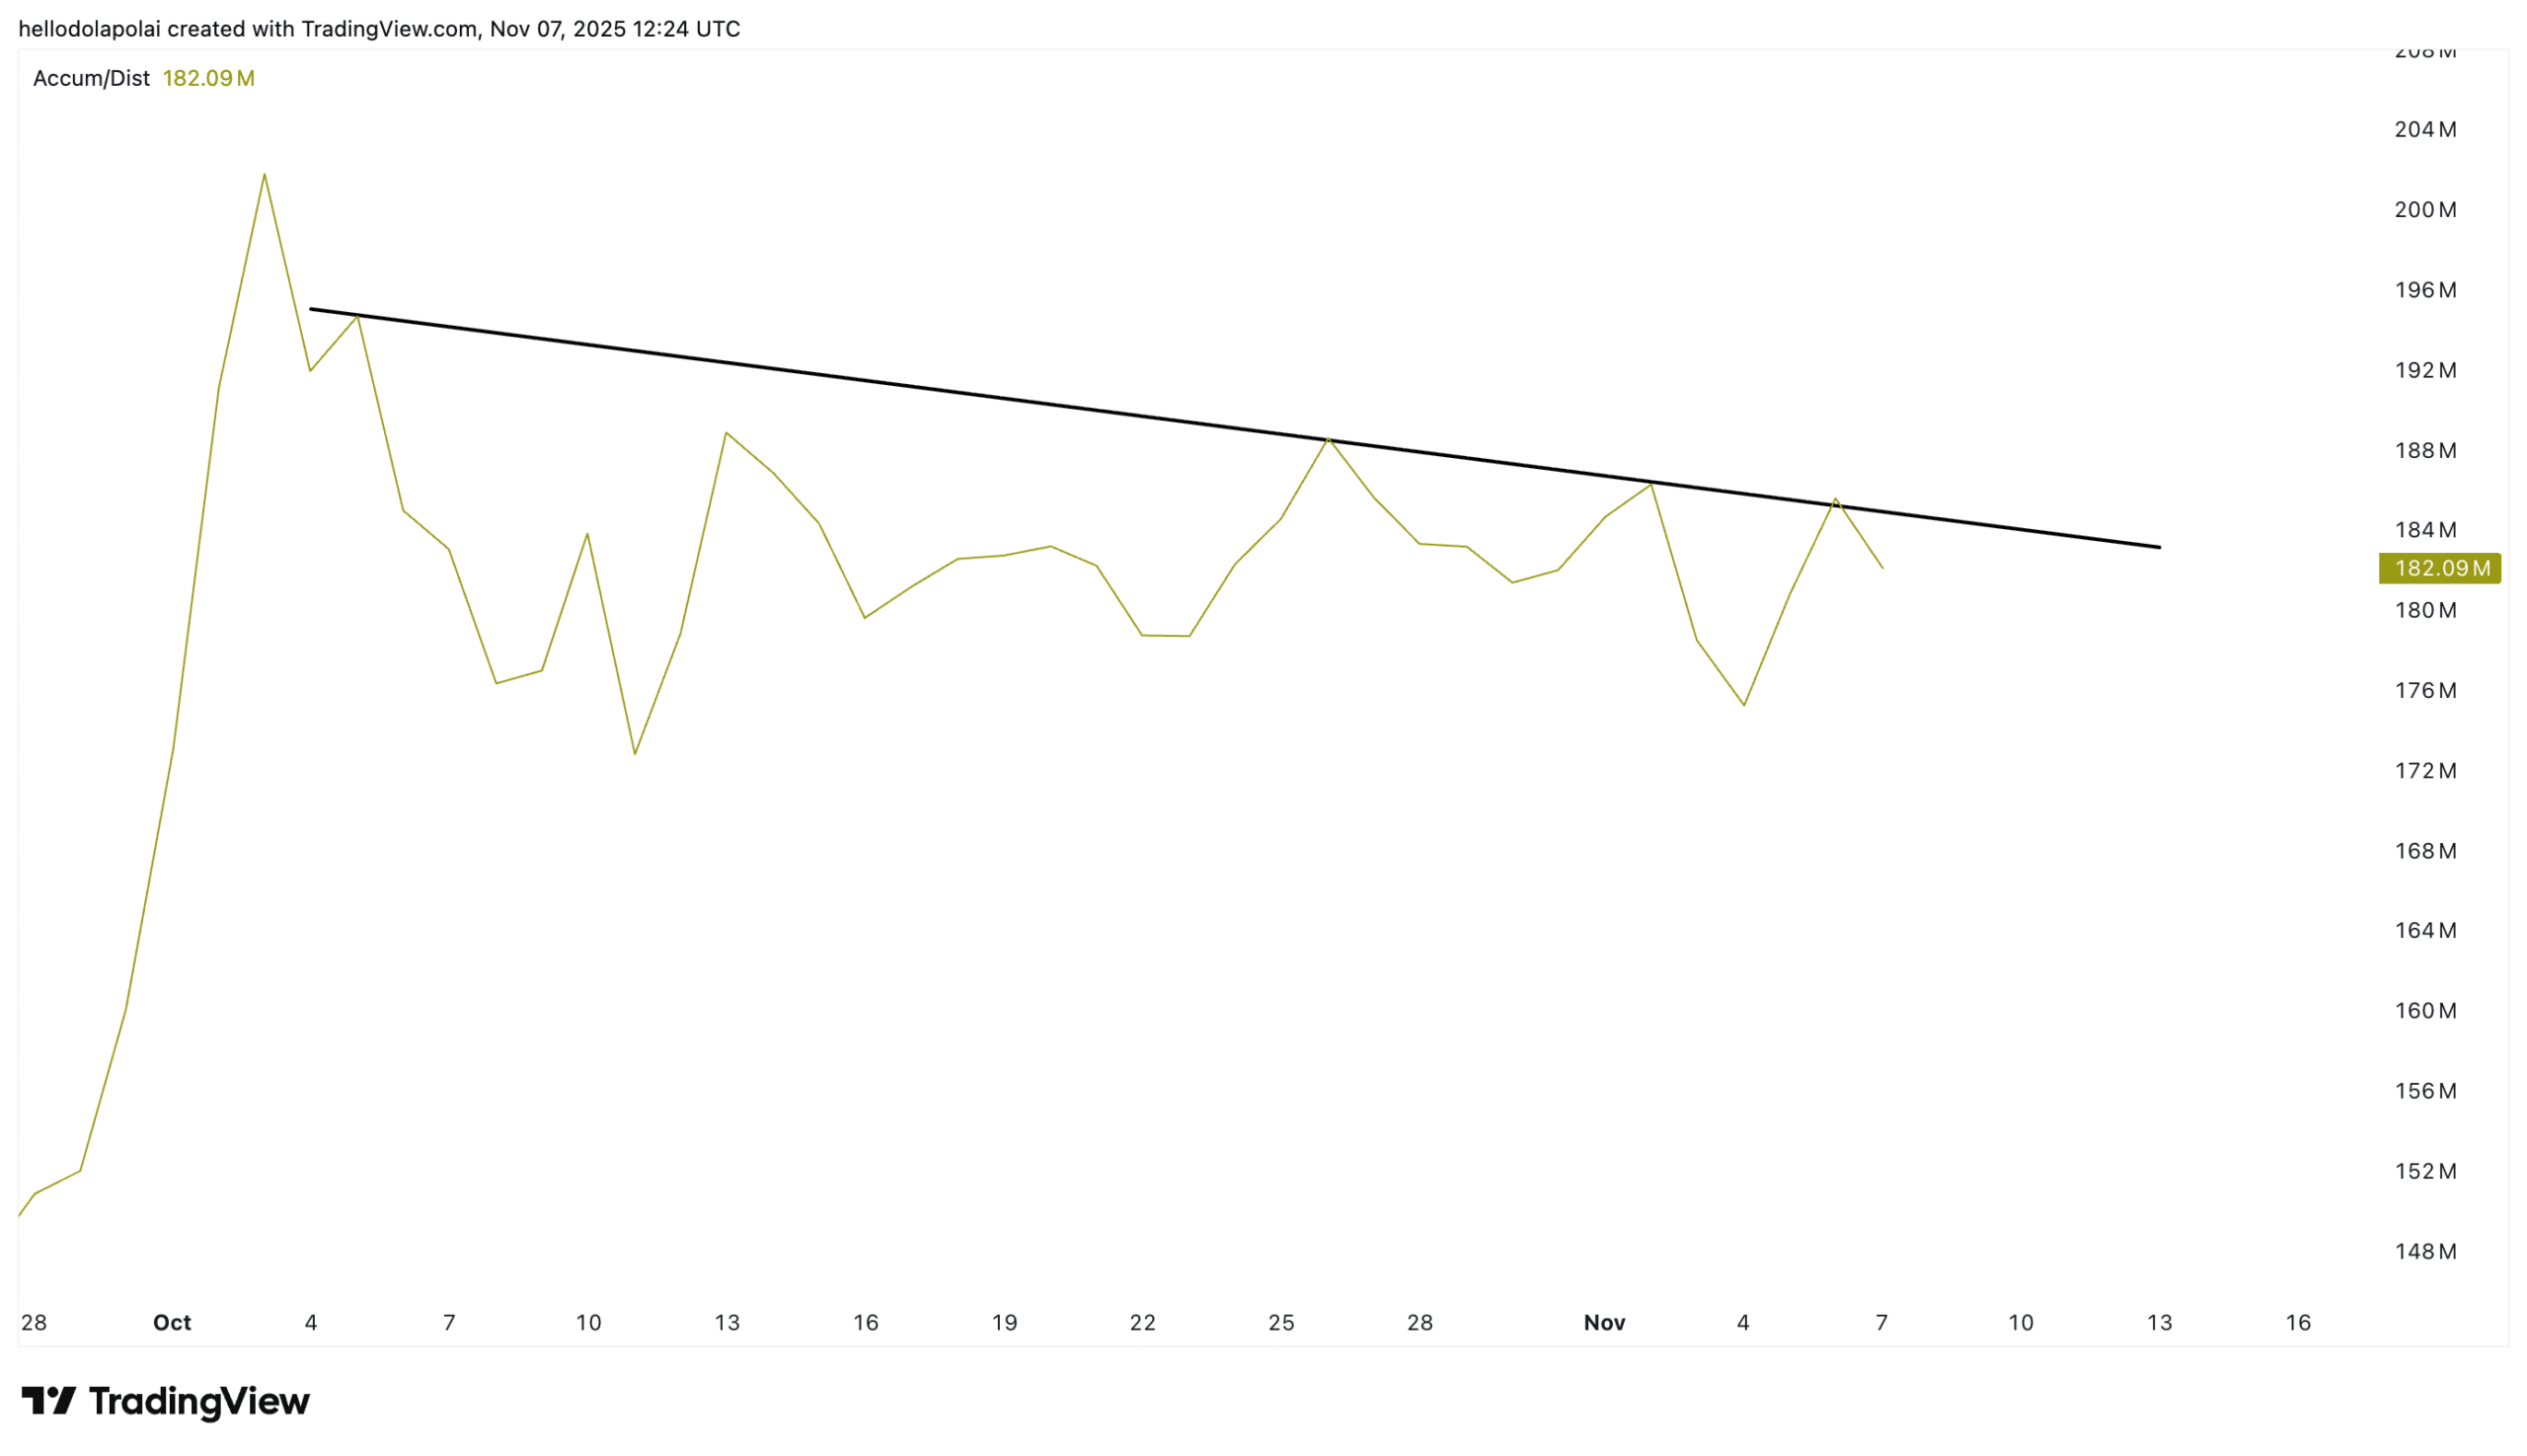
Source: TradingView
Notably, the AD indicator has now formed a pattern of interest as it approaches a key resistance zone. If accumulating investors continue to gather momentum, there’s a strong possibility that APT will break through this resistance level.
Such a breakout could mark a significant price move, potentially pushing APT beyond the $4 threshold and setting a new local high.
Go to Source to See Full Article
Author: Olayiwola Dolapo