
The BONK price increased considerably in February, breaking out from diagonal and horizontal resistance levels.
Will the price sustain this increase, or was the movement just a relief rally? Let’s find out.
BONK Breaks Out From Resistance
The technical analysis of the daily time frame shows the BONK price broke out from a descending resistance trend line on February 7. Before the breakout, the trend line had existed for 55 days.
More specifically, the trend line had existed since the all-time high on December 15, 2023. Today, BONK reached a high of $0.000014 before falling slightly.
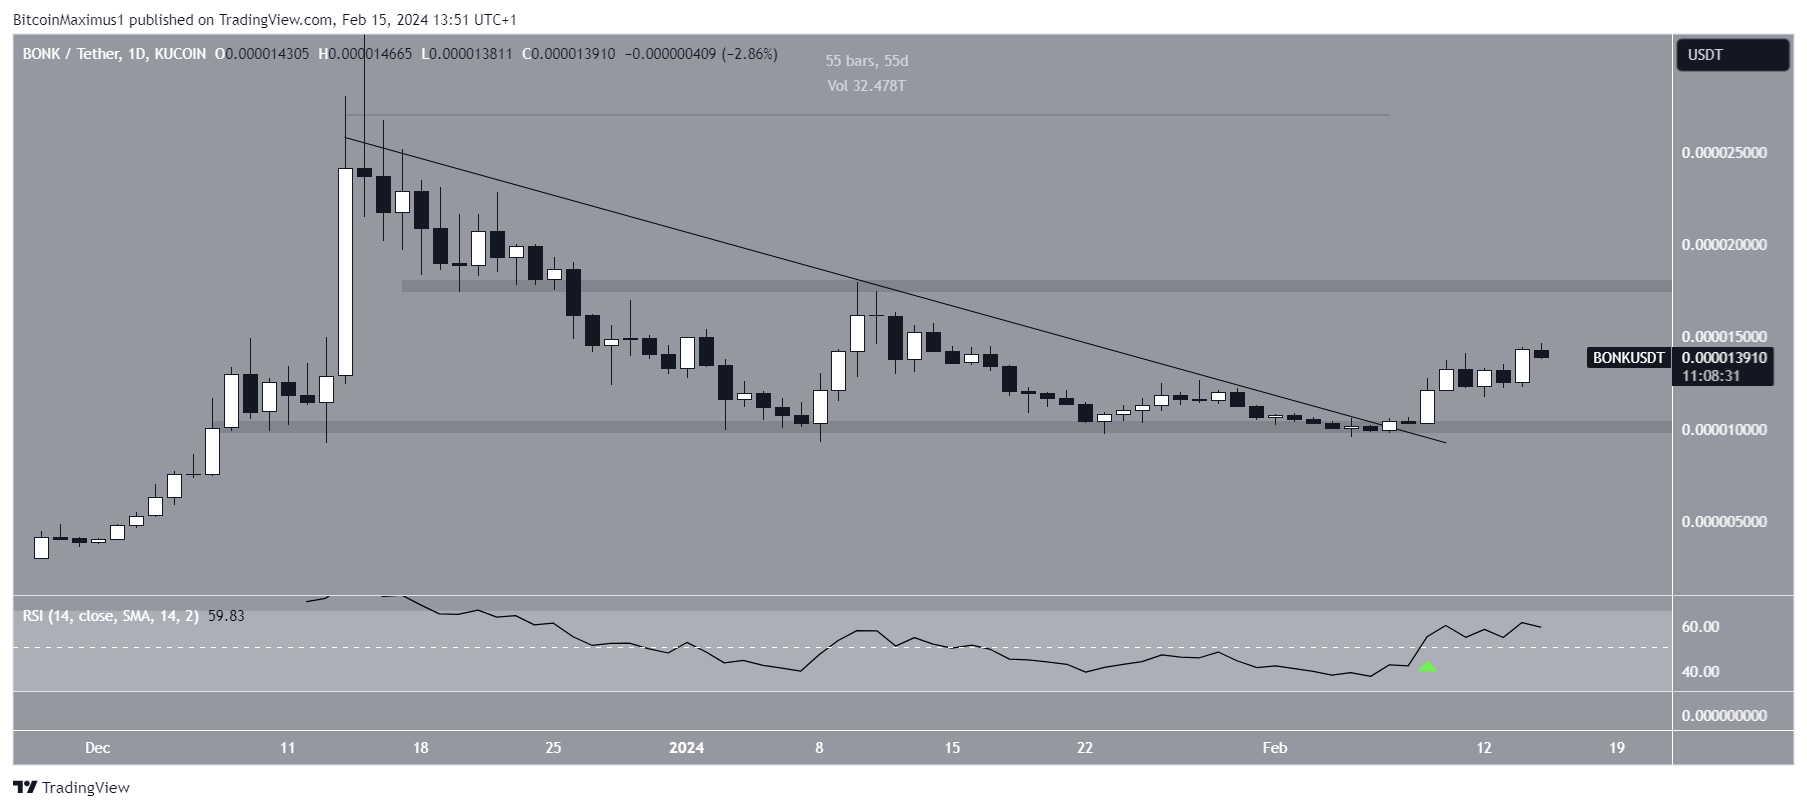
The daily Relative Strength Index (RSI) gives a bullish reading. Traders utilize the RSI as a momentum indicator to assess whether a market is overbought or oversold and whether to accumulate or sell an asset.
If the RSI reading is above 50 and the trend is upward, bulls still have an advantage, but
Go to Source to See Full Article
Author: Valdrin Tahiri
Tip BTC Newswire with Cryptocurrency
Donate Bitcoin to BTC Newswire

Donate Bitcoin Cash to BTC Newswire

Donate Ethereum to BTC Newswire

Donate Litecoin to BTC Newswire

Donate Monero to BTC Newswire

Donate ZCash to BTC Newswire


