- Cardano’s symmetrical triangle pattern could lead to a major price surge or downside risk
- Whale activity and broader market trends will shape the altcoin’s next price action
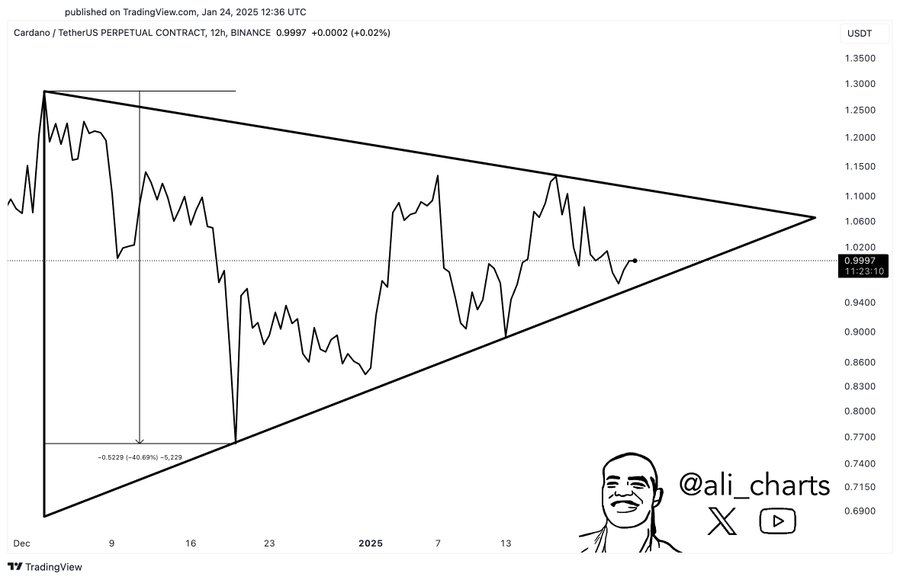
Cardano [ADA] finds itself at a pivotal juncture, with its price movement narrowing into a symmetrical triangle pattern – One that often precedes a significant breakout. This period of consolidation has caught the attention of market watchers, who forecast a potential 40% price surge if momentum shifts to the upside.
While the pattern leaves room for both bullish and bearish scenarios, the tightening range seemed to indicate that heightened volatility may be imminent. With ADA’s next move likely to set the tone for its short to mid-term trajectory, the market is closely watching for signs of a decisive breakout.
Why symmetrical triangles often precede price breakouts
Symmetrical triangles form when an asset’s price consolidates on the charts, creating lower highs and higher lows. This pattern reflects a balance between buyers and sellers, progressively narrowing the range until a breakout occurs.
Symmetrical triangles do not inherently signal direction, but often precede sharp price movements due to the buildup of market pressure.
Popular analyst Ali Martinez highlighted ADA’s price action within such a triangle, with the support near $0.83 and resistance around $1.06.
The prolonged consolidation seemed to align with historical precedents, one where the breakout direction typically matches the prevailing trend. Given ADA’s setup, the market is now awaiting a breach of either boundary. This could trigger a 40% move in the breakout’s direction.