Disclaimer: The information presented does not constitute financial, investment, trading, or other types of advice and is solely the writer’s opinion.
- The selling volume behind AAVE was not indicative of potent bearish pressure in August, which meant a rally was not unreasonable
- The price action showed that the structure and momentum favored the sellers across multiple timeframes
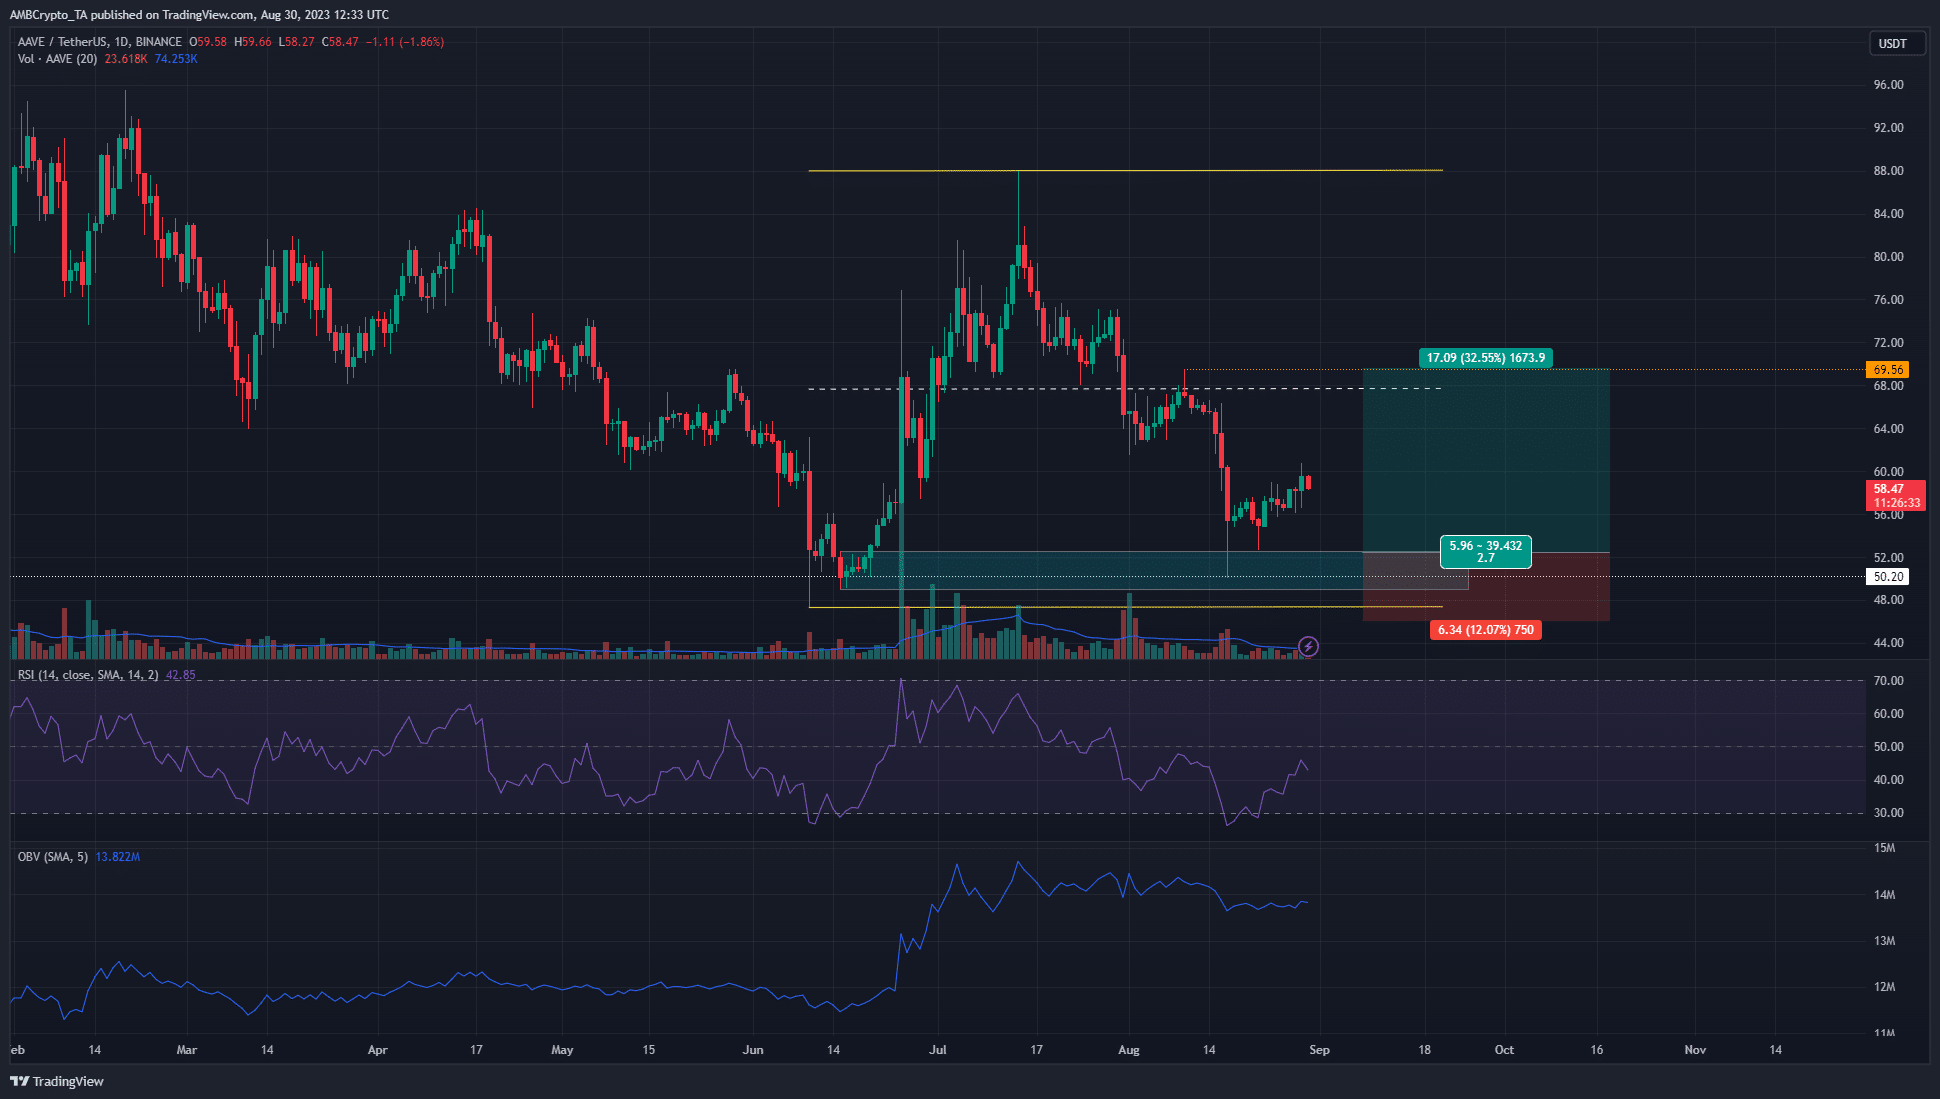
Aave [AAVE] has been in a downtrend on the weekly chart since June 2021. This June, the price saw a rally from $49 to $88- but it wasn’t enough to shift the higher timeframe downtrend. However, there could be another such rally later this year.
Read Aave’s [AAVE] Price Prediction 2023-24
The $50 psychological level has served as support since November 2020. There have been days where the selling activity was so great that AAVE temporarily reached the $44-$45 mark, but it has rebounded in the past. Here’s what investors can wait for before looking to buy the token.
A move to the $50 area could yield a good risk-to-reward buying opportunity
The daily chart saw a bearish structure emerge after AAVE fell below the $68.7 level on 31 July. This bearish bias remained unbroken, with the recent lower high at $69.5. The RSI agreed with the structure as it was unable to climb past the neutral 50 level. To the south, the $50 level coincided with a bullish order block from 15 June that was highlighted by the cyan box.
When AAVE retested this demand zone on 17 August, it saw a positive reaction. The lower timeframe charts such as 4-hour showed a bullish structure developed in the past week. However, the $61.5-$64.8 area represented a strong resistance zone.
A high probability buying opportunity would arise if AAVE falls to the $40-$50 area. This might not materialize soon, for the OBV has remained relatively flat over the
Go to Source to See Full Article
Author: Akashnath S
Tip BTC Newswire with Cryptocurrency
Donate Bitcoin to BTC Newswire

Donate Bitcoin Cash to BTC Newswire

Donate Ethereum to BTC Newswire

Donate Litecoin to BTC Newswire

Donate Monero to BTC Newswire

Donate ZCash to BTC Newswire


