Disclaimer: The information presented does not constitute financial, investment, trading, or other types of advice and is solely the writer’s opinion.
- The lower timeframe price action showed the bears were heavily favored.
- Ethereum was trading at a higher timeframe support zone, where recovery could be initiated.
Ethereum [ETH] has trended downward on the lower timeframe price charts in the past two weeks. Its recent attempts to reclaim the $1700 level were met with failure. The falling MVRV ratio suggested the downtrend was likely to continue.
Read Ethereum’s [ETH] Price Prediction 2023-24
The price action showed the structure was bearish across multiple timeframes from the daily to the 1-hour chart. ETH was within a higher timeframe area of interest where buyers would be interested, but it hasn’t materialized yet. Here’s what the prices can do in the coming week.
There is a strong chance Ethereum can descend to $1400 if it can’t bounce soon
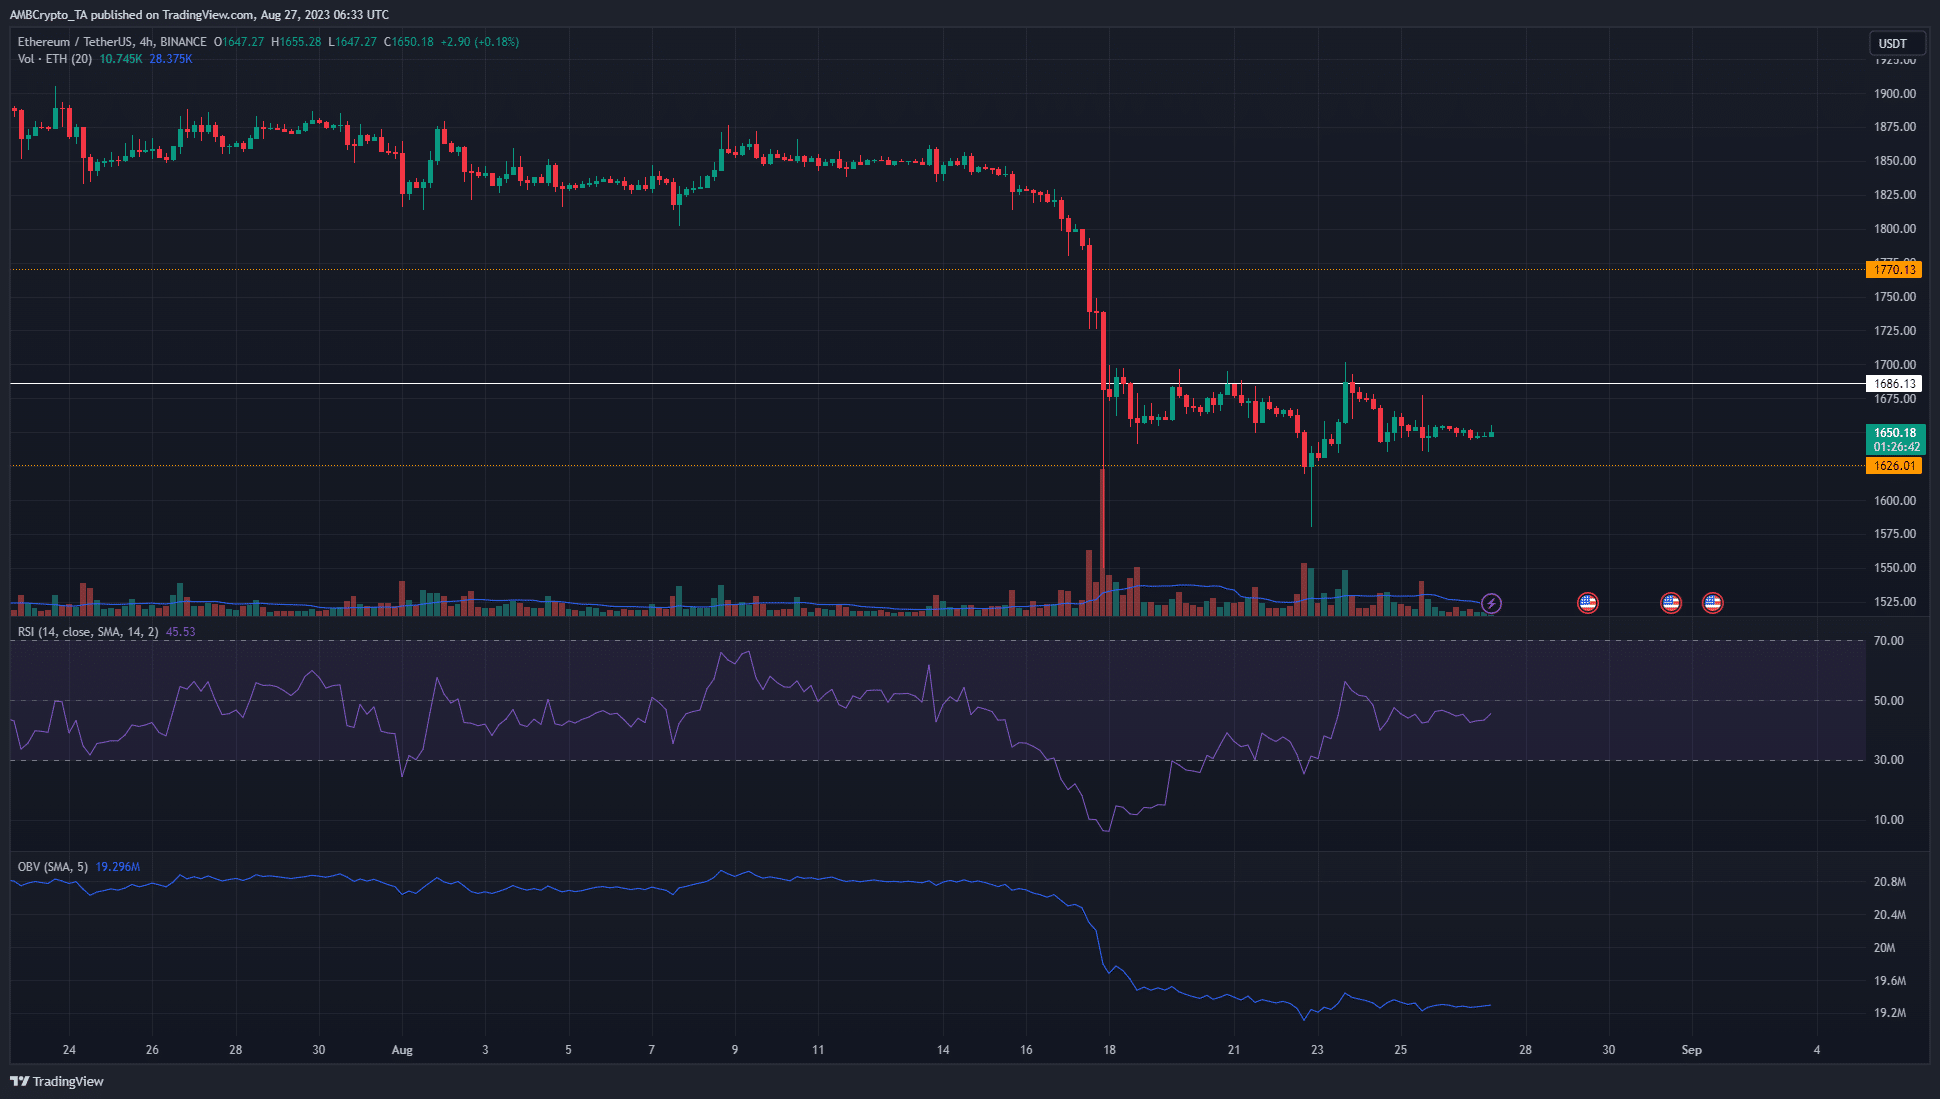
The price action of the past two weeks indicated a robust bearish sentiment. The series of lower highs and lower lows have continued in the past four days, although the momentum slowed down. The 1-day chart showed that the $1625-$1680 was a demand zone, where the previous Ethereum rally reaching $2020 was initiated.
Hence a bullish structure break on the H4 chart would be the first step toward recovery. The RSI climbed toward neutral 50 to signal a shift in momentum. Yet the OBV did not ascend by a notable amount. This highlighted weak demand and a lack of volatility.
A move below $1620 and a retest of the $1620-$1650 region could offer an opportunity to short ETH. To the south, the $1520-$1550 region could serve
Go to Source to See Full Article
Author: Akashnath S
Tip BTC Newswire with Cryptocurrency
Donate Bitcoin to BTC Newswire

Donate Bitcoin Cash to BTC Newswire

Donate Ethereum to BTC Newswire

Donate Litecoin to BTC Newswire

Donate Monero to BTC Newswire

Donate ZCash to BTC Newswire


