Disclaimer: The information presented does not constitute financial, investment, trading, or other types of advice and is solely the writer’s opinion.
- The higher timeframe price action of Ethereum showed a bearish structure.
- A bounce could develop after such a large drop, making the $1780-$1800 an area of interest for bears to defend.
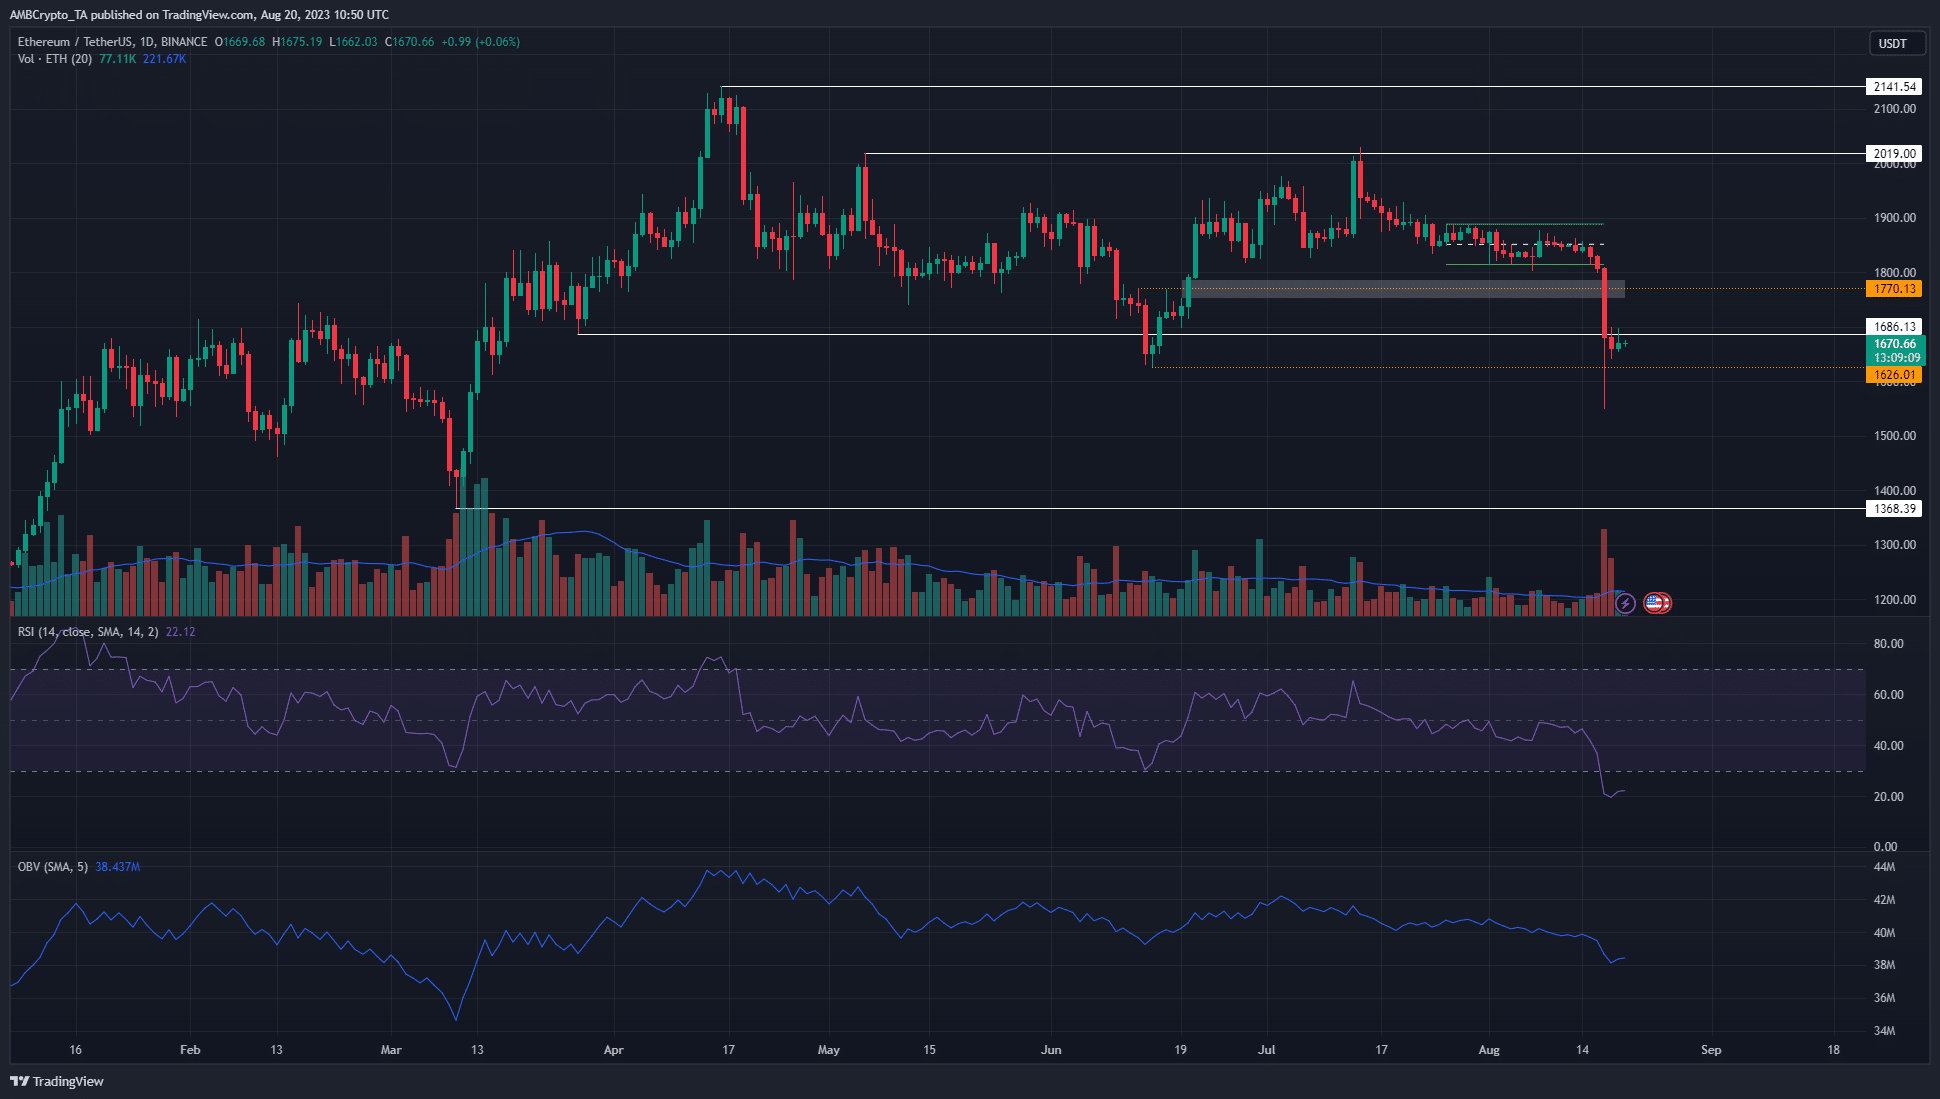
On 6 May, Ethereum [ETH] formed a lower high at $2019, a level that was retested as resistance on 14 July. After this retest, the asset has trended downward. The recent drop on 17 August was followed almost immediately by good news.
Is your portfolio green? Check the Ethereum Profit Calculator
ETF applications for Ethereum were likely to be approved, according to a Bloomberg report. Could this optimism fuel an ETH recovery? The price was at a support zone that stretched back to mid-January.
The $1170 and $1630 levels were both breached, showing bearish intent
On the daily price chart, Ethereum flipped the market structure to bearish on 2 August. ETH bulls managed to defend the $1820-$1850 support zone since mid-June, but they were finally overcome. The recent wave of selling brought ETH as low as $1550 on 17 August on Binance.
The RSI and OBV fell lower and reflected bearish momentum and large selling pressure. While a 1-day trading session had not yet closed below $1626, the wick to $1550 signaled bearish dominance.
Therefore, traders can wait for a move upward to sell ETH in anticipation of rejection from a le
Go to Source to See Full Article
Author: Akashnath S
Tip BTC Newswire with Cryptocurrency
Donate Bitcoin to BTC Newswire

Donate Bitcoin Cash to BTC Newswire

Donate Ethereum to BTC Newswire

Donate Litecoin to BTC Newswire

Donate Monero to BTC Newswire

Donate ZCash to BTC Newswire


