
Solana price has rebounded back above $85 on Friday morning, retracing back some of its losses following Wednesday’s rally. However, it still remains below a key SMA level that puts it at risk of moving to its next leg lower over the coming sessions.
Summary
- Solana price rebounds above $85 but remains below the key 50-day SMA, keeping downside risk intact.
- Repeating a three-step pattern signals consolidation phase may precede another sell-off.
- Failure to reclaim the $86 level could trigger a sharp decline toward $52.
According to data from crypto.news, Solana (SOL) price rose 4.5% to an intraday high of $85.2 before stabilizing around $83 at the time of writing. The rebound following a market-wide recovery as Bitcoin moved above $73,000 helped the altcoin to backpedal on some of its losses experienced since dropping from its Wednesday high.
Despite the token’s recent rebound, it remains at risk of a more downside in the coming weeks, as it has failed to reclaim a key SMA level, failure of which has historically led to strong downsides.
The daily chart shows that Solana price has been trading within the $76 to $92 range since February this year. The token recently moved into the lower end of this range in the past two weeks.
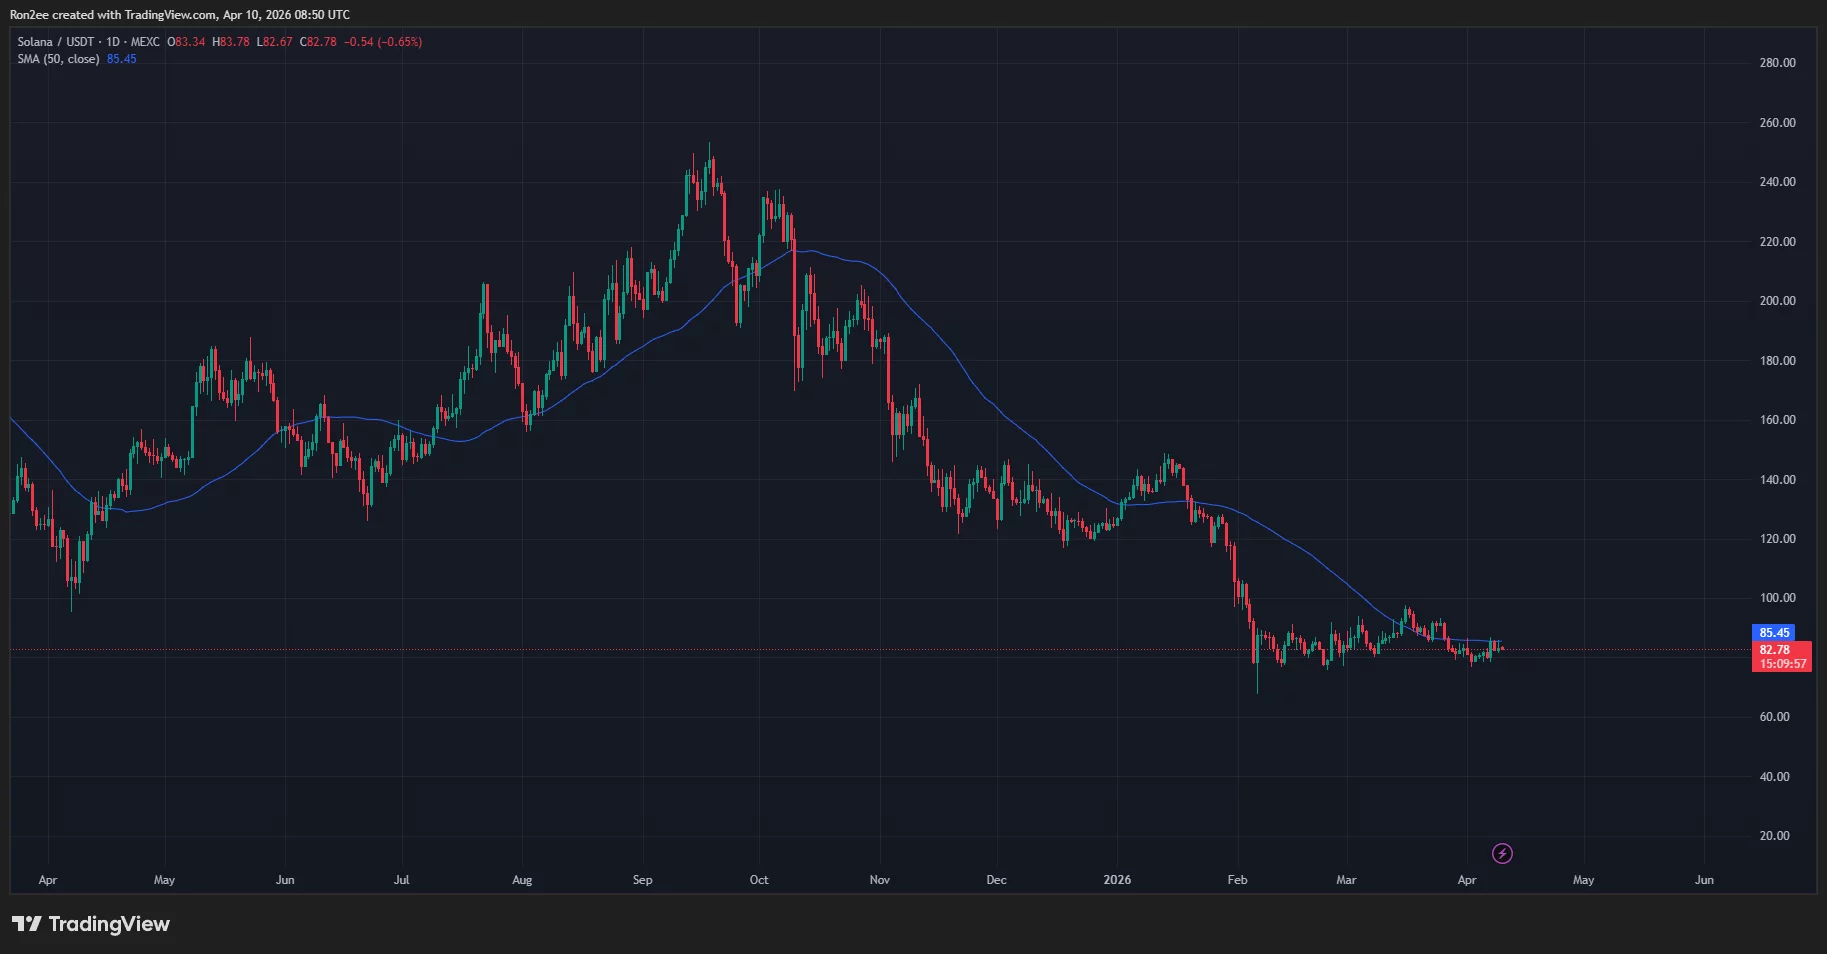
In doing so, Solana price has fallen below the 50-day SMA, which has historically been followed by significant bearish pressure since October 2023.
Notably, Solana price movement has been repeating a three-step cycle every time it prepares to transition to its next leg lower in the past six months.
The said pattern begins when Solana price reclaims the 50-day SMA, which is then followed by a rapid fall back below the indicator while losing the support of previous highs. Following this, the token enters into a consolidation trap, a period when the token moves sideways within a tight range before its final breakdown towards its next leg down begins.
As derived from the daily chart above, Solana price previously formed this pattern in November last year and again at the beginning of January this year, each time it fell below the 50-day SMA and subsequently entered a consolidation phase for weeks. Following this, it faced a strong sell-off, finally settling lower and forming a new local bottom.
In the most recent instance, Solana price moved above the key resistance in mid-March when it surged all the way to $97. The token has since been on a downtrend, making lower lows and lower highs in the process. Moving on to the last couple of days, the token has been stuck in its consolidation phase in the second step of the current cycle as it hovers between $79 and $81, and rests below the 50-day SMA around the $86 mark.
Assuming that the pattern holds, the ongoing sideways movement should not be interpreted as a sign of stabilization but as the token coiling before initiating its next leg down.
As such, if Solana fails to reclaim the $86 50 day SMA level in the coming sessions, it risks a rapid decline towards $52, a level calculated by subtracting the average percentage drop observed during previous cycles from the current consolidation peak.
Disclosure: This article does not represent investment advice. The content and materials featured on this page are for educational purposes only.
Go to Source to See Full Article
Author: Rony Roy