
Pepecoin’s price has dropped by more than 70% three weeks after establishing its record high of $0.00000449. And the memecoin could fall even more in the coming days, according to a mix of technical and fundamental indicators.
PEPE charts flash a classic bearish reversal pattern
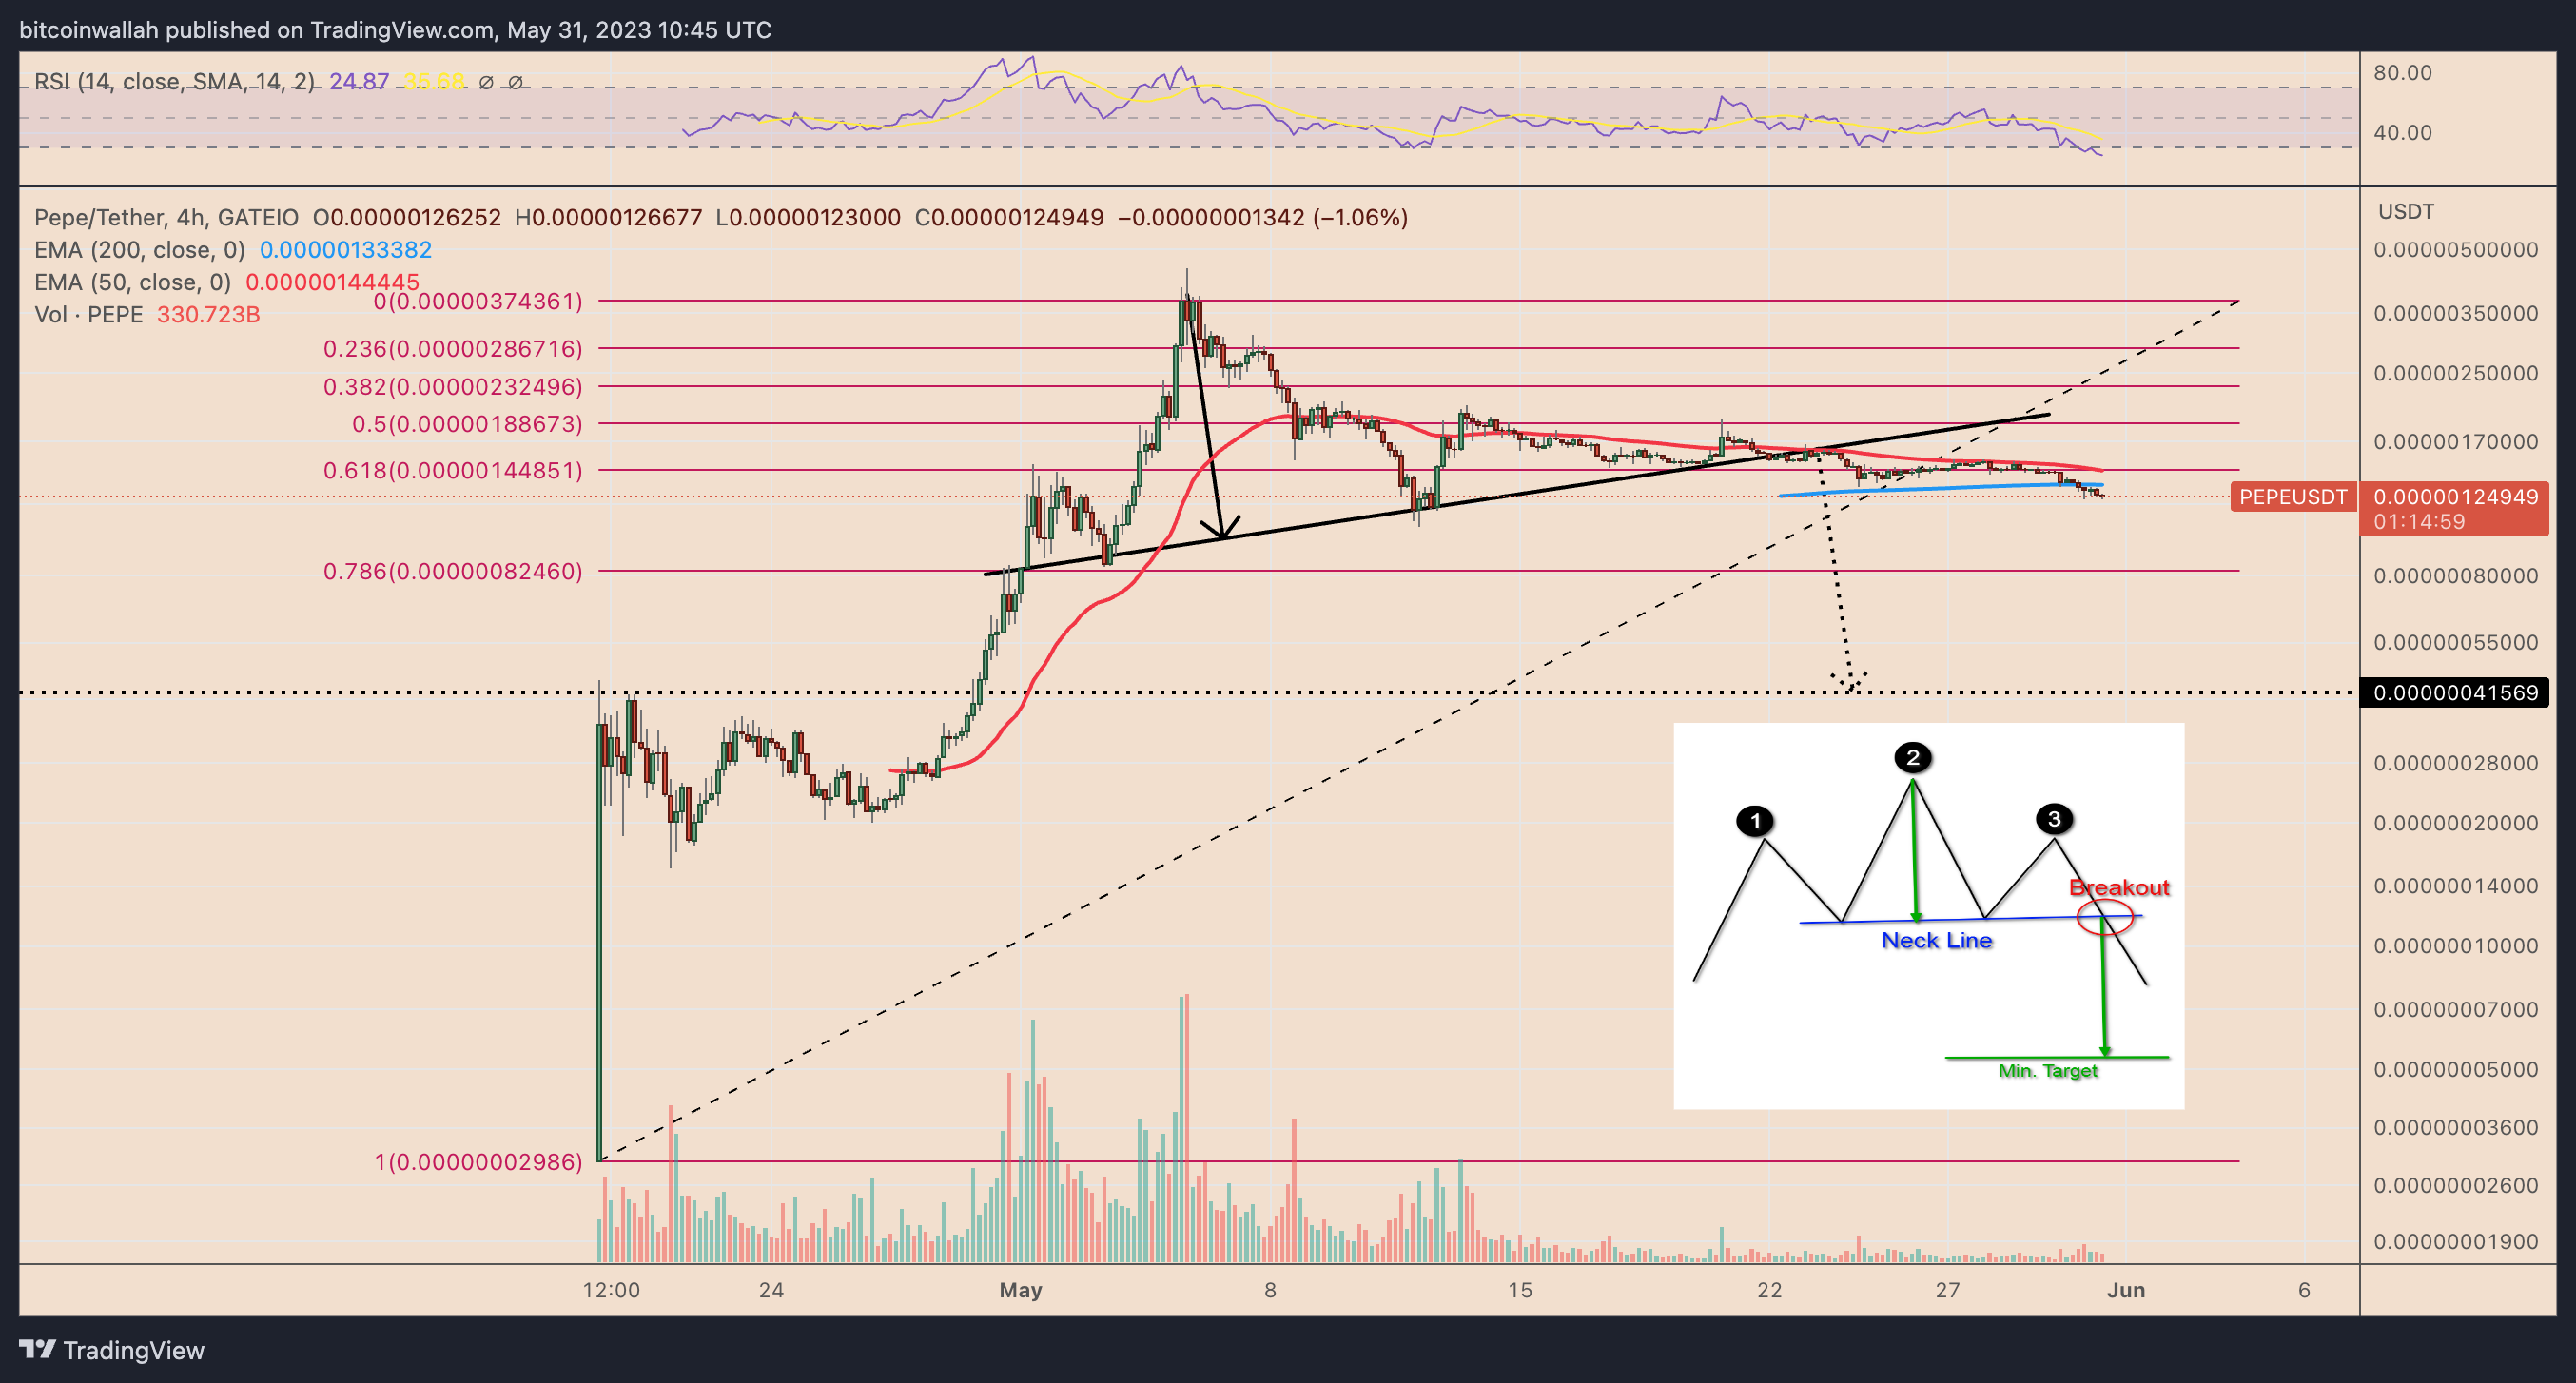
From a technical standpoint, the price of Pepecoin (PEPE) could drop sharply from its current levels. At the core of this bearish outlook lies the classic head-and-shoulders (H&S) pattern.
Analysts who use technical analysis view the H&S pattern as a bearish reversal indicator for the unversed. It forms when the price forms three peaks atop a common neckline support; the middle peak, called the “head,” is higher than the other two, called the “left shoulder” and “right shoulder.”
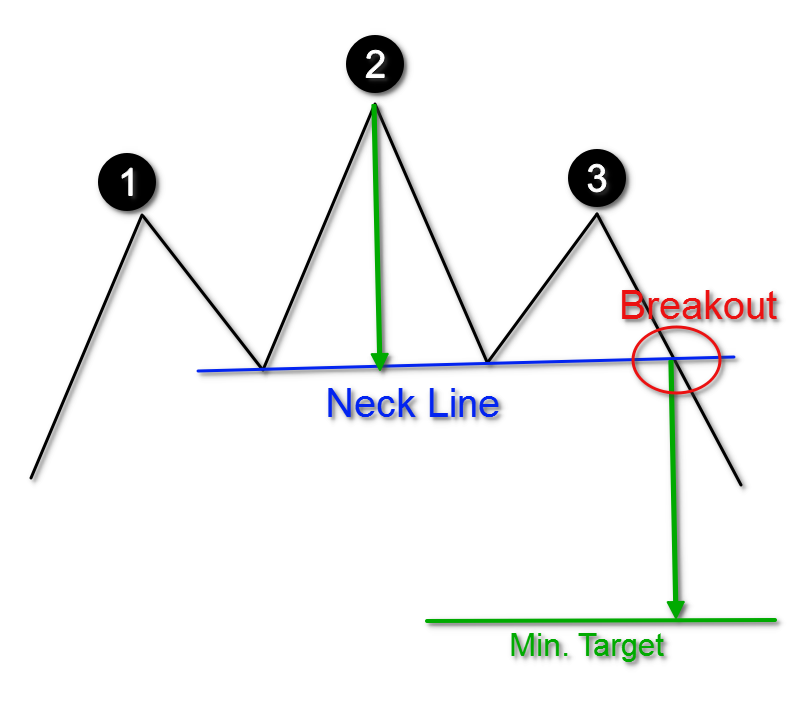
The H&S pattern resolves after the price breaks below its neckline. Meanwhile, as a rule of technical analysis, traders measure the pattern’s downside target by adding the maximum distance between the head and neckline to the breakdown point.
On May 22, PEPE broke below its H&S neckline, near $0.00000156. That puts its downside target near $0.00000041 in June, down around 70% from current price levels.
Go to Source to See Full Article
Author: Yashu Gola
Tip BTC Newswire with Cryptocurrency
Donate Bitcoin to BTC Newswire

Donate Bitcoin Cash to BTC Newswire

Donate Ethereum to BTC Newswire

Donate Litecoin to BTC Newswire

Donate Monero to BTC Newswire

Donate ZCash to BTC Newswire
