Pepe has continued to rally over the past day as it gains dominance in the memecoin market.
However, the rally has not been without its hiccups, as several bearish signals suggest the market condition is not fully bullish yet.
Pepe face hurdle of a 39% drop
Pepe [PEPE] has now traded into a cautious position as price rallies into a key resistance zone on the chart. This level is concerning, particularly due to price reactions here in previous market instances.
The last two times price reached this level, it experienced a 19.39% decline on both occasions, suggesting strong selling pressure.
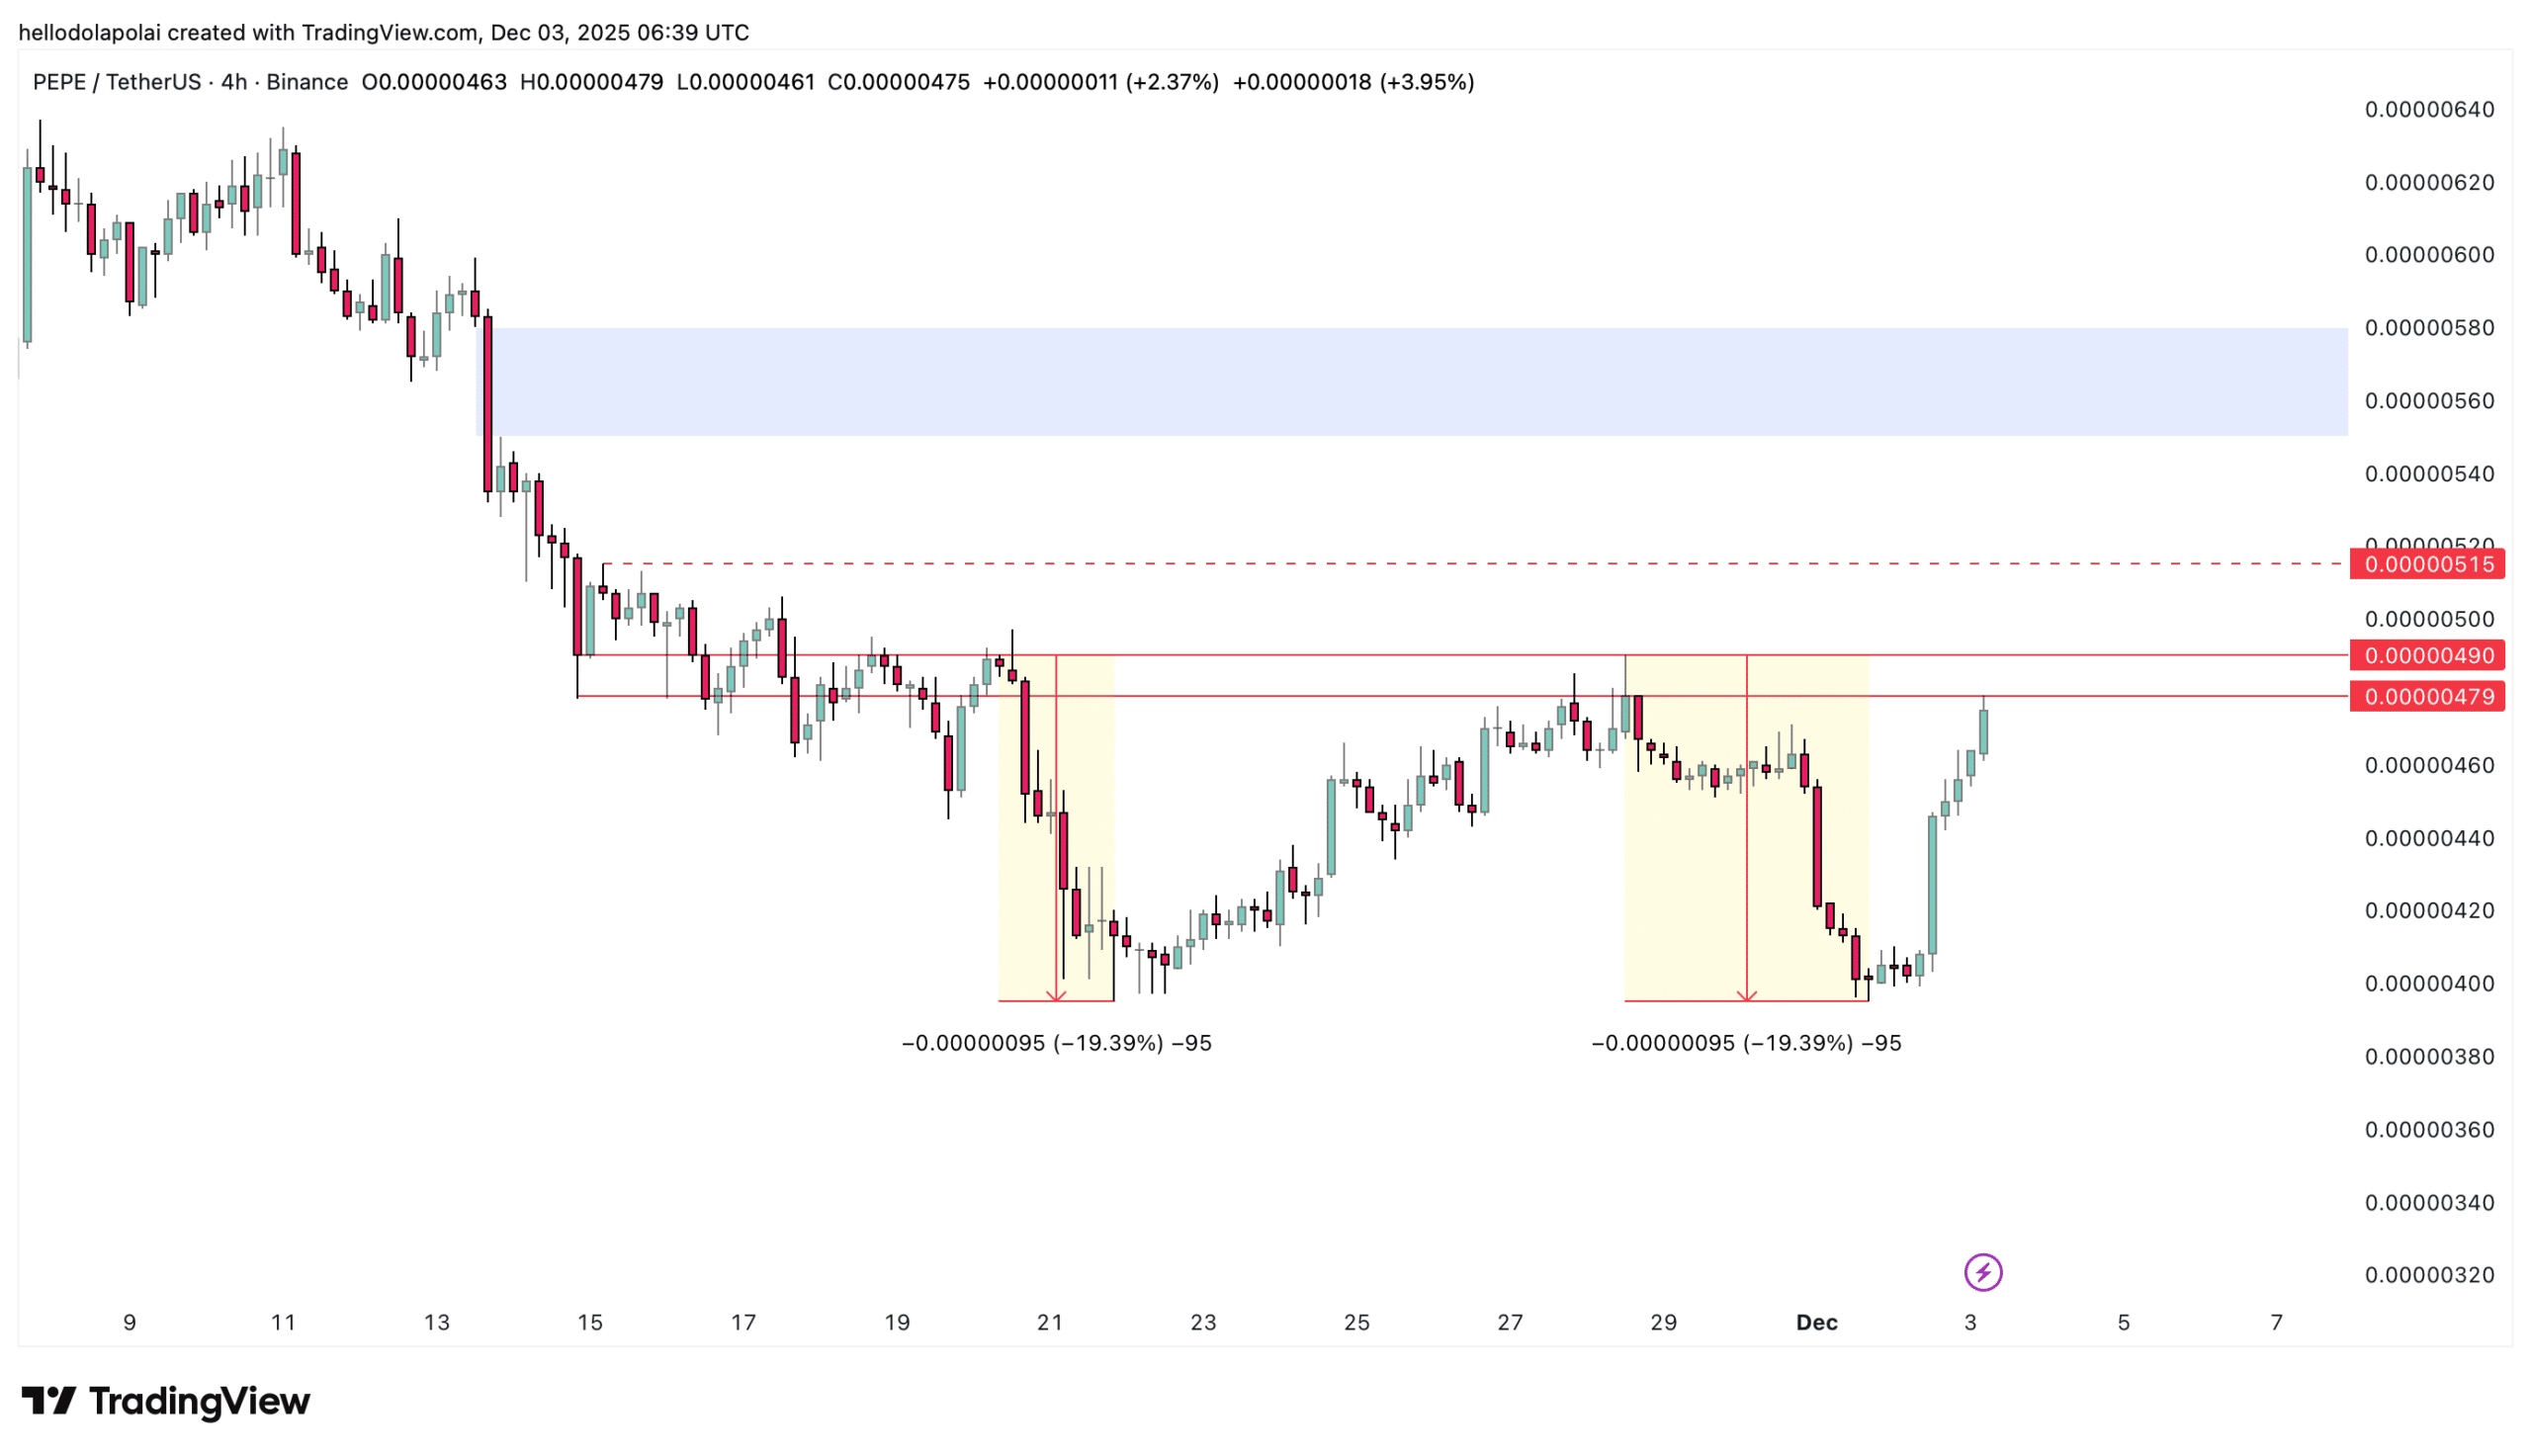
Source: TradingView
With price entering this level again, it implies that PEPE faces a similar risk.
In the most positive scenario, if price overcomes this barrier, it could rally into a supply FVG on the chart between $0.00000550 and $0.00000580.
In the short term, a closer level marked with dashed lines at $0.00000515 remains important. Selling pressure at this level is expected to be minimal, implying there could still be further upside.
Momentum shows a bullish outlook
Press time momentum indicators showed that there was a chance that PEPE could overcome the selling barriers marked on the chart at this time.
The Moving Average Convergence Divergence (MACD) showed that momentum remained strong, as the blue MACD line crossed above the orange signal line.
More importantly, the blue MACD line entered positive territory on the chart, implying heightened market interest.
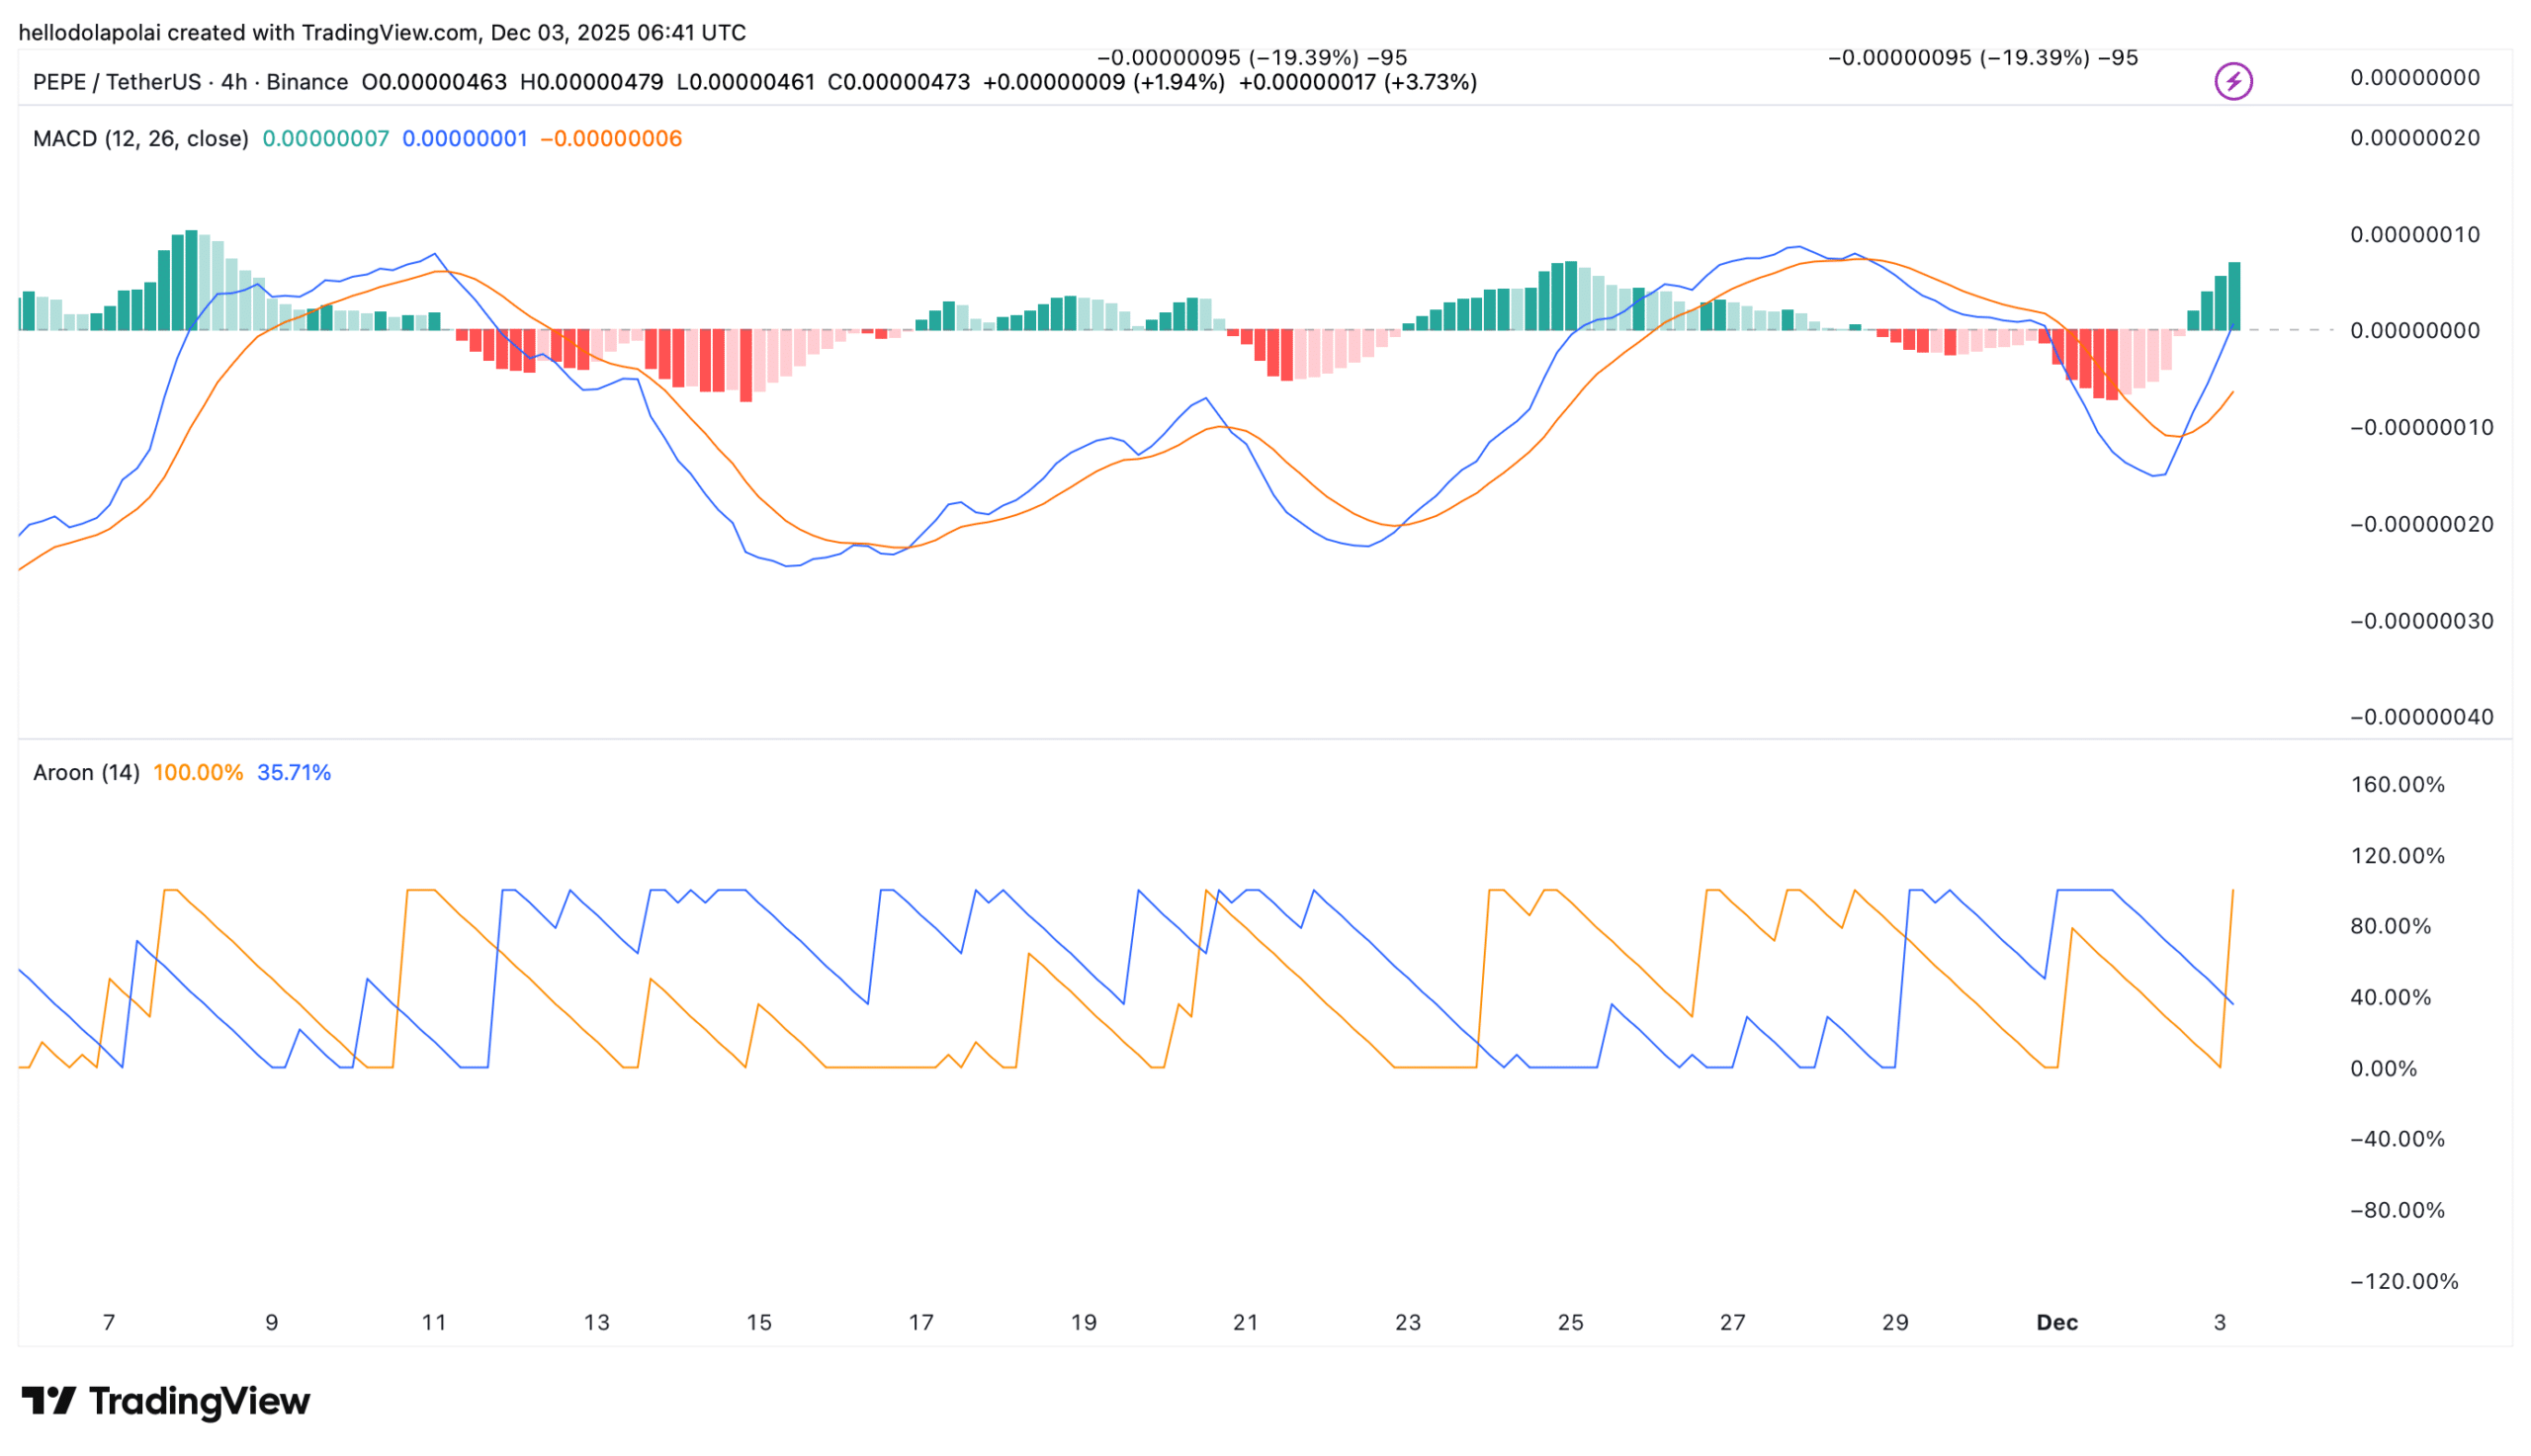
Source: TradingView
Likewise, the Aroon Indicator, which uses the Aroon Up and Aroon Down to determine whether the market is bullish or bearish, continued to point to a bullish trend.
This is based on the Aroon Up (orange) remaining above the Aroon Down (blue), indicating that bullish momentum remained dominant in the market.
If this trend continues across these indicators, there is a strong chance for a bullish recovery that could push price beyond the selling zone.
Liquidity clusters raise concern
There is still a bearish probability on the chart, based on the liquidation heatmap.
The heatmap, at the time of writing, showed levels of liquidity clusters, which are known to attract price action, either above or below current levels.
Significant clusters sat below the current price, suggesting a higher tendency for price to sweep lower.
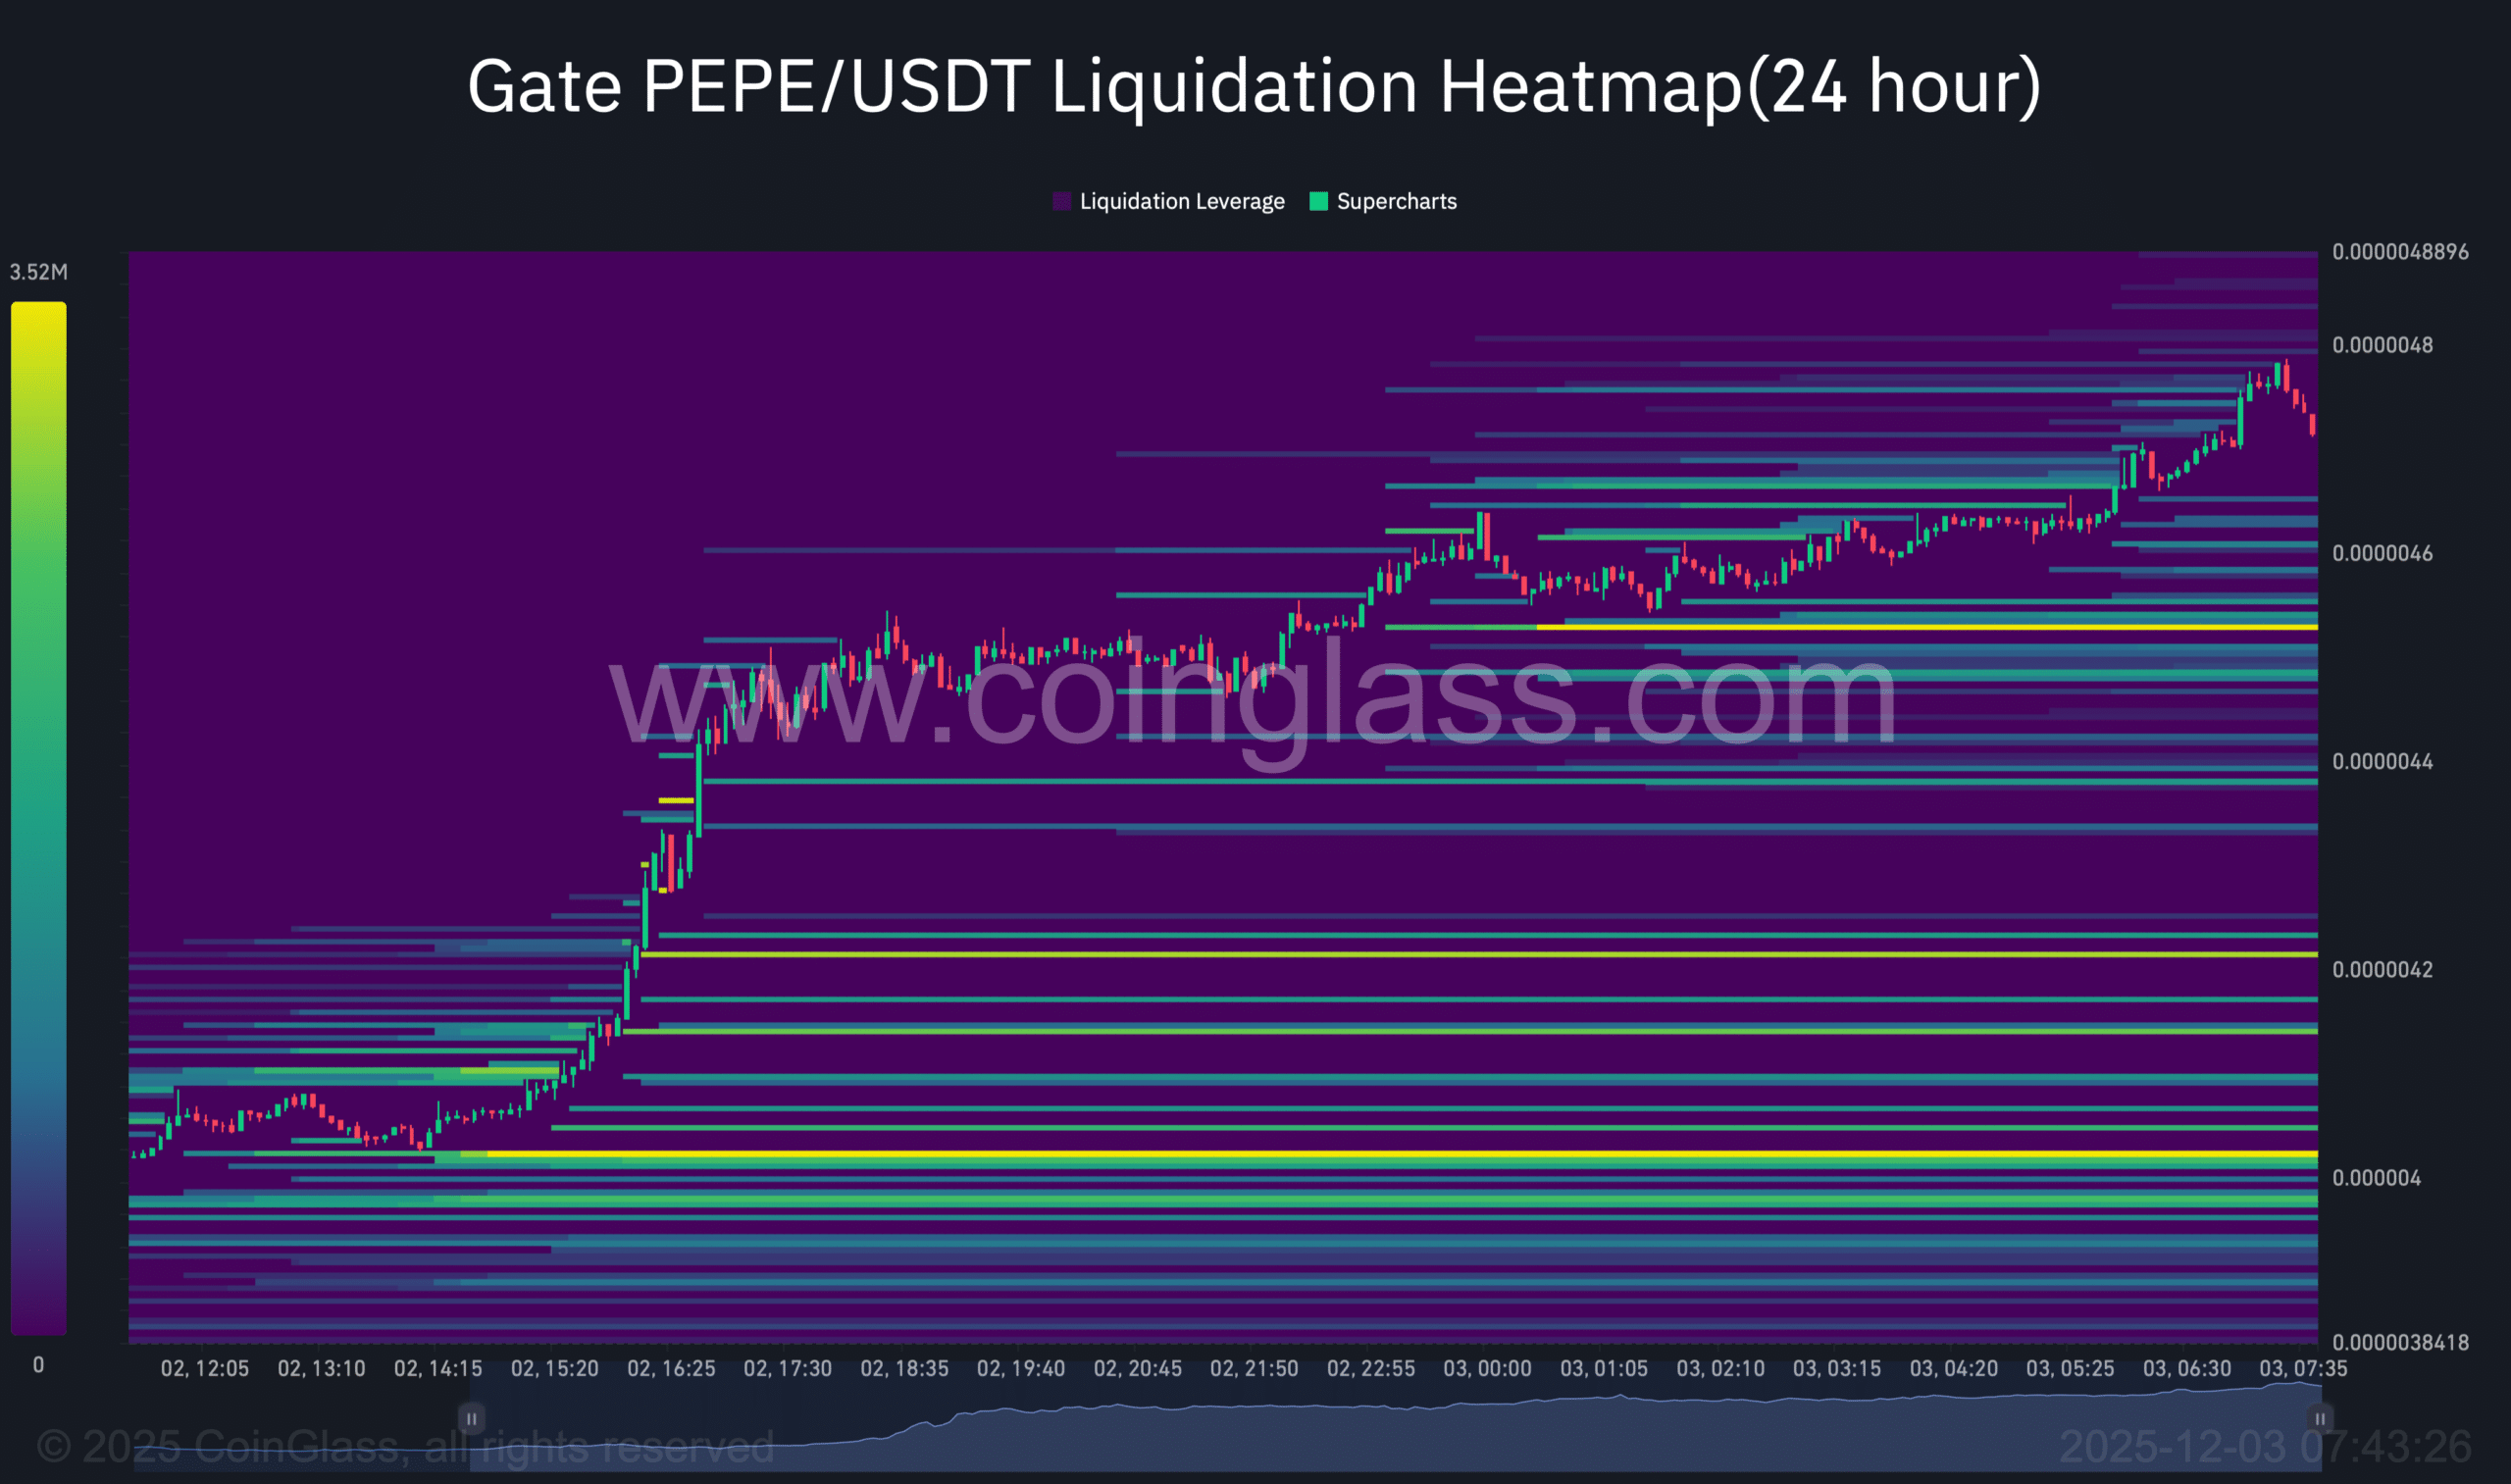
Source: CoinGlass
If these clusters pull the price downward, the move aligns with the supply zone marked on the chart, which is likely to push it lower. For now, the price reaction around this zone will determine where PEPE heads next.
Final Thoughts
- PEPE faces major price resistance ahead, with a chance of triggering another 19.39% drawdown.
- Indicators show a high possibility of a breakout, but hovering liquidity clusters remain a serious concern.
Go to Source to See Full Article
Author: Olayiwola Dolapo