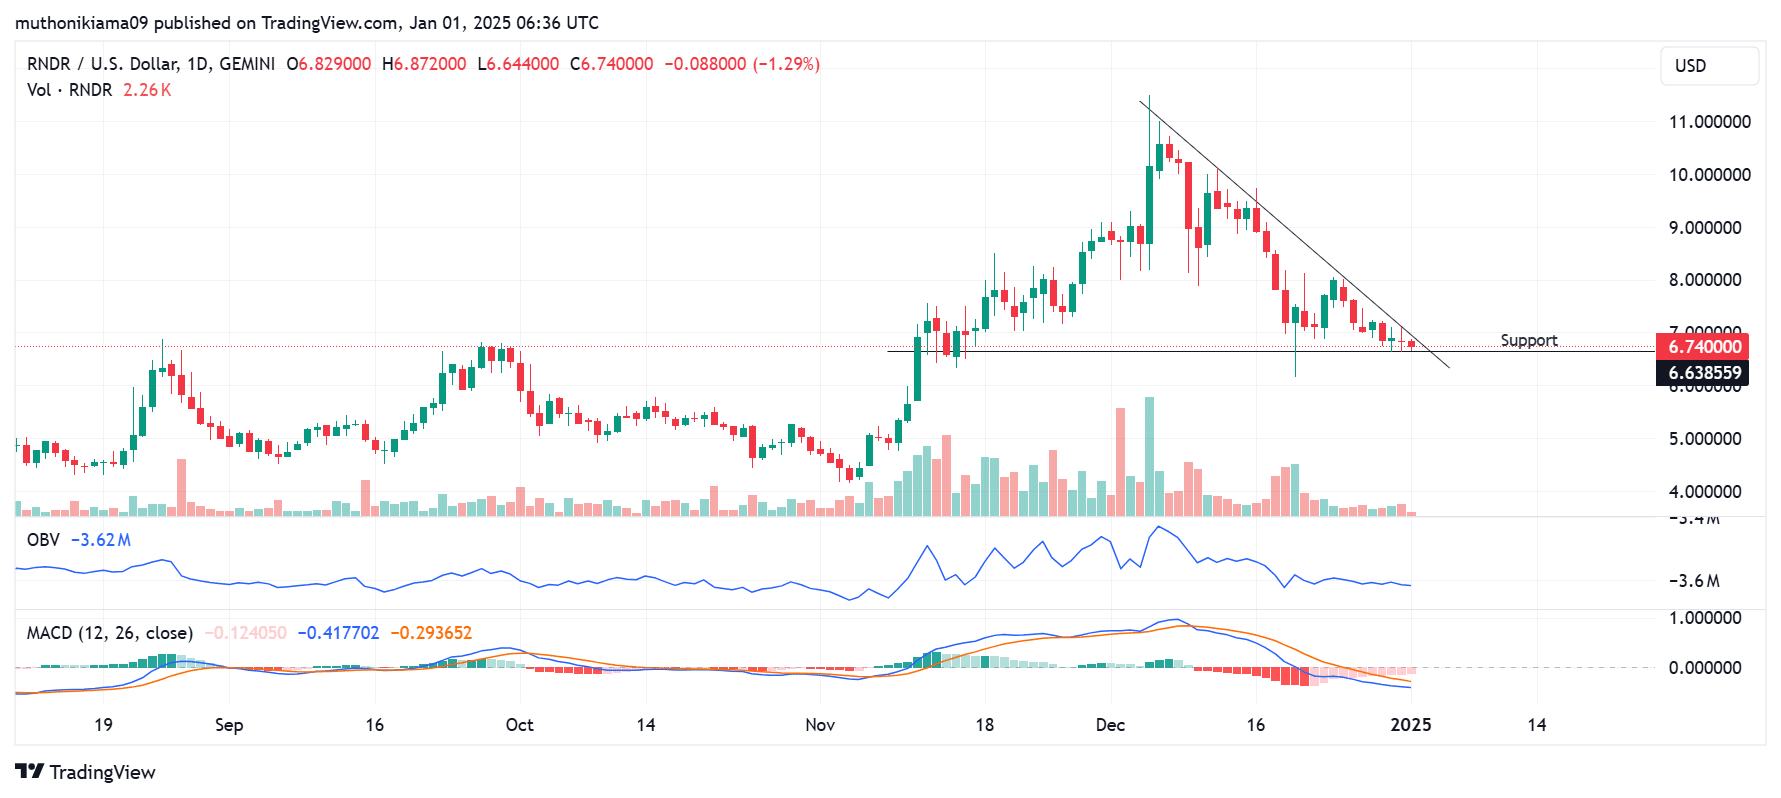
- Render was trading within a descending triangle pattern on its one-day chart, indicating it was in a clear downtrend.
- Whale activity also increased, with transactions exceeding $100,000 increasing from 148,460 to 866,180 tokens.
Render [RNDR] was trading at $6.73, at press time, after a slight 0.58% drop in 24 hours. Trading volumes had also dropped by 24% per CoinMarketCap, indicating a decline in market participation.
While Render gained by 51% in 2024, the long-term outlook shows bearish trends that could weigh on RNDR’s price in 2025.
Render’s descending triangle pattern
Render was trading within a descending triangle pattern on its one-day chart, indicating a clear downtrend.
Additionally, the On-Balance-Volume (OBV) indicator was dropping, confirming that the downtrend was due to selling activity. If buyers remain hesitant, it will hinder the potential for recovery.
Source: TradingView
The Moving Average Convergence Divergence (MACD) line indicated bearish momentum as it oscillated below the signal line. However, the histogram bars suggest that the bearish strength is weakening, which could lead to price consolidation.
Key levels to watch include support at $6.60. If Render drops below this level, it could trigger further declines. Conversely, $7 is acting as strong resistance, and a break above this level could signal a bullish reversal.
Whale activity spikes
Amid the prevailing bearish trends, Render whales are becoming active once again. According to IntoTheBlock data, transactions exceeding $100,000 have significantly increased in the last two days, rising from 148,460 RNDR to 866,180 RNDR.
Author: Muthoni Mary