- Algorand had a bearish market structure on the daily chart
- Reduced speculations and spot demand suggested further losses may be likely in the short-term
Algorand [ALGO] was one of the coins that did well in the past cycle, one that revived itself last month and went on a good bullish run. In fact, it gained by 480% in a month, but began to recede in early December.
Additionally, the altcoin’s volume indicators outlined trouble ahead on the price front.
Algorand losing bullish momentum
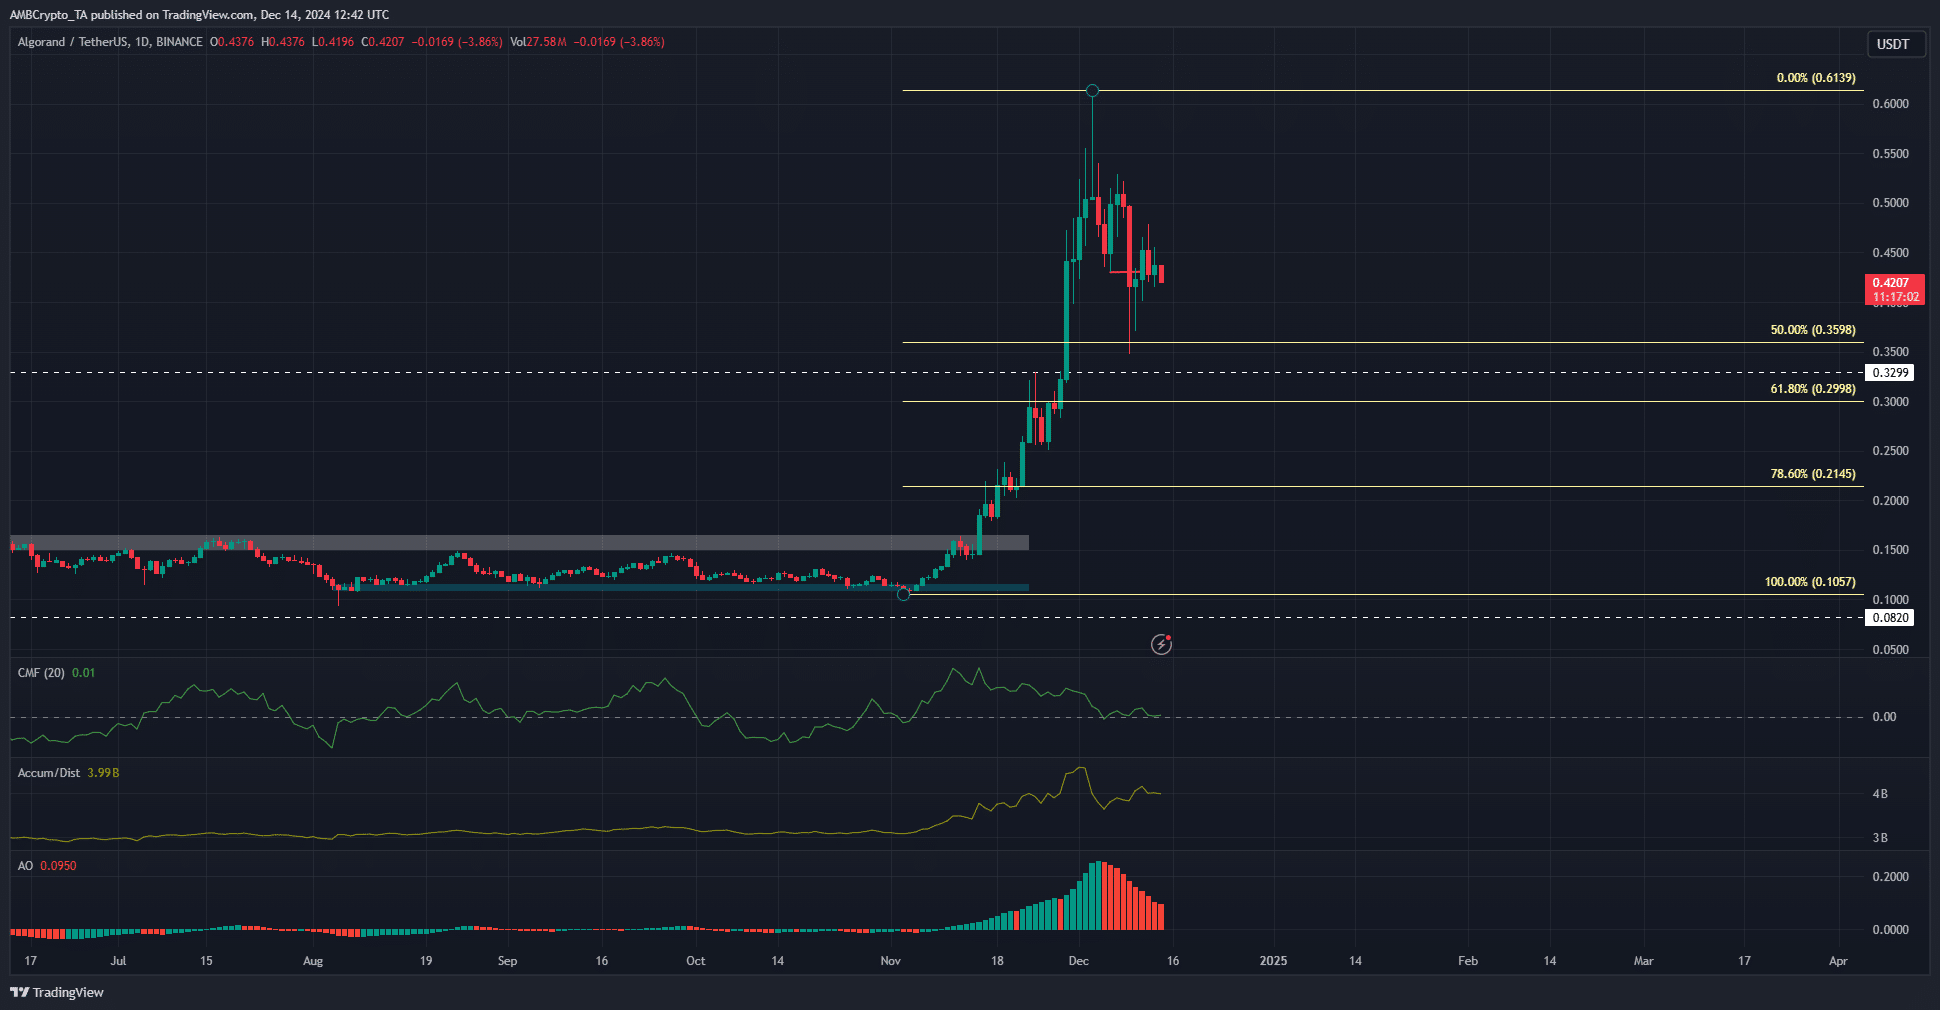
Source: ALGO/USDT on TradingView
ALGO has been forced to retreat from its local high at $0.613. The retracement began in the first week of December, when Bitcoin [BTC] was still trading within its short-term range. Over the last three days, BTC broke above the range and climbed past $100k again. And yet, at press time, ALGO was falling again.
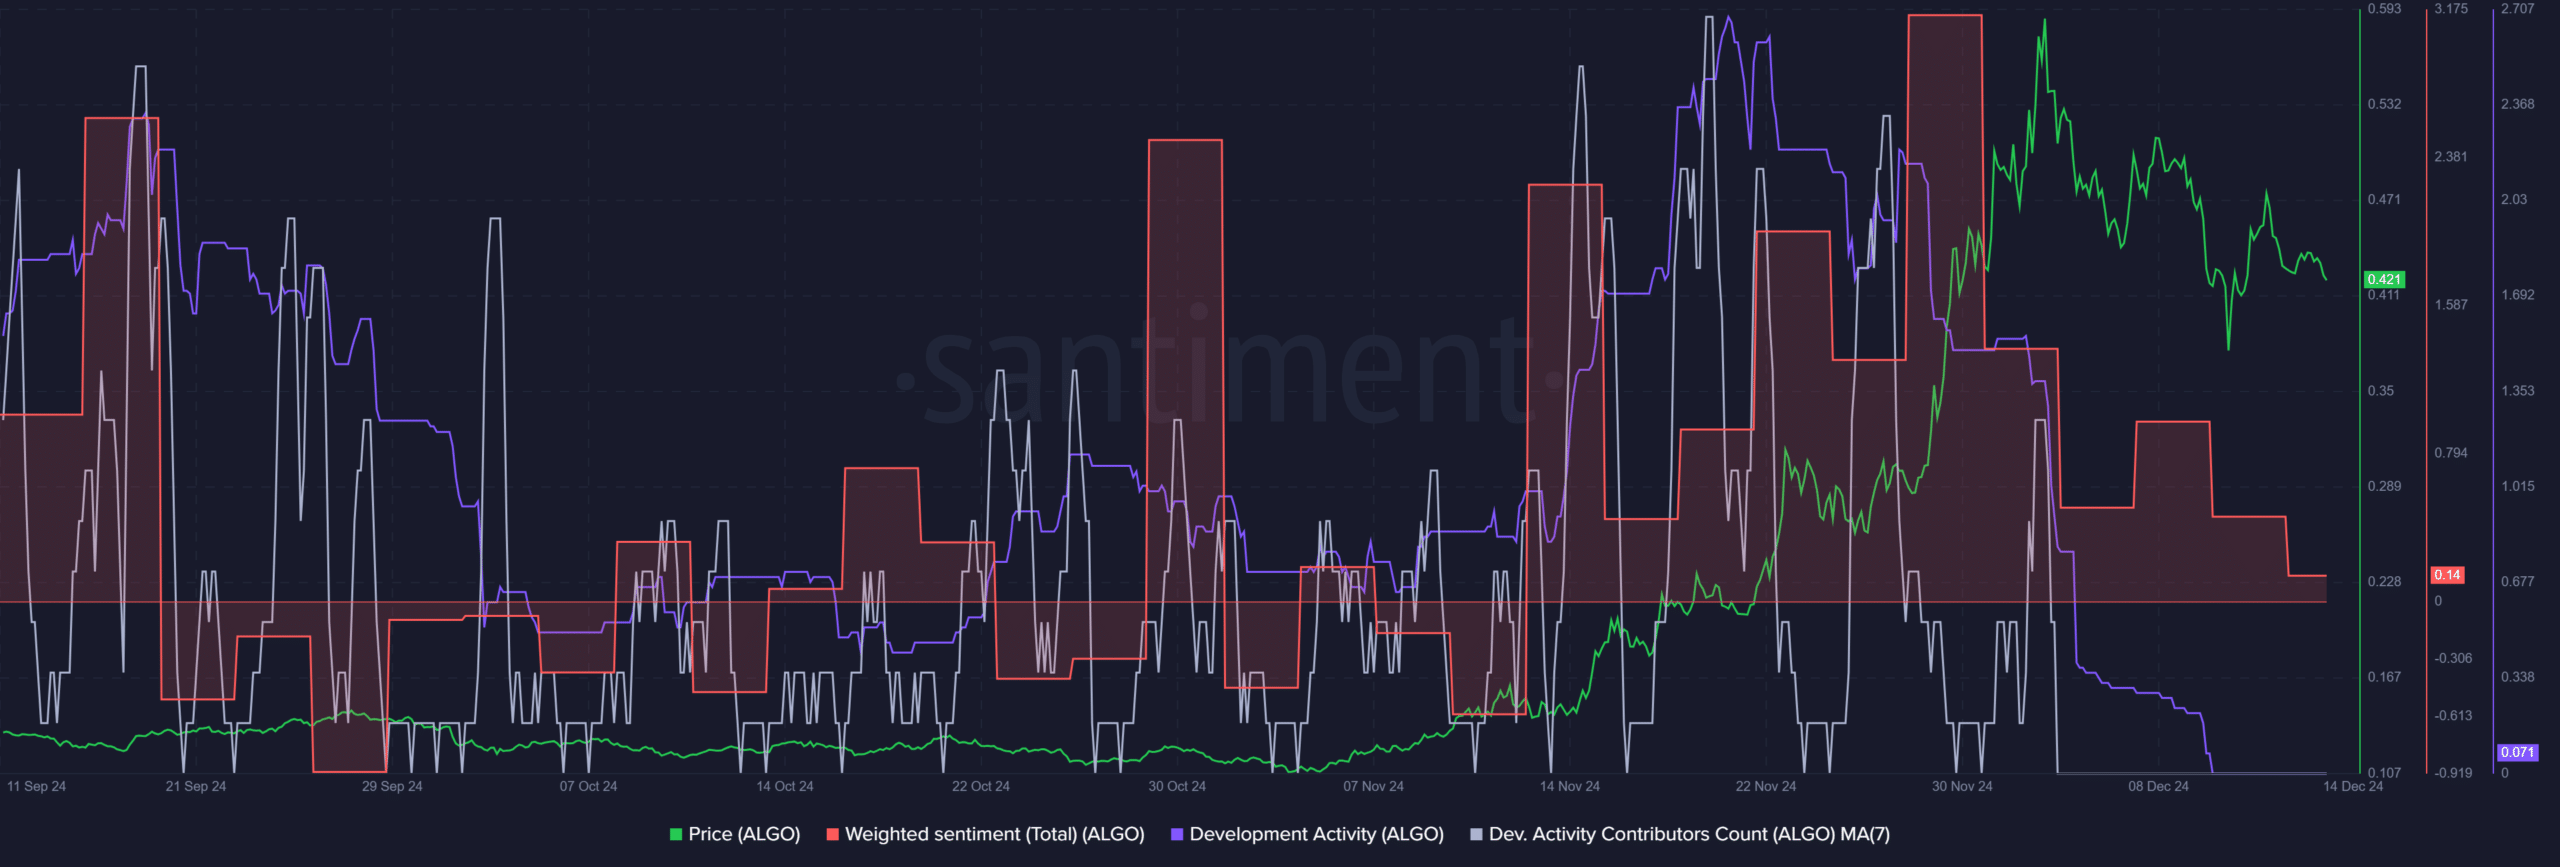
The market structure of Algorand flipped bearishly on the 1-day chart on 9 December. Since then, the CMF has trended south to show decreased capital inflows. Its press time reading of +0.01 indicated neutrality and was not enough to recover a bullish structure.
The A/D indicator was also slumping on the charts. The two volume indicators highlighted how Algorand bulls were losing strength quickly over the last ten days. The Awesome Oscillator highlighted the loss of momentum too.
The Fibonacci retracement levels would be the next support levels to watch. The 50% level at $0.36 has been tested as support, but it is likely that ALGO would test it again. The $0.3 and $0.2145 levels could be the targets for the next month or two. Unless the demand for Algorand can recover.