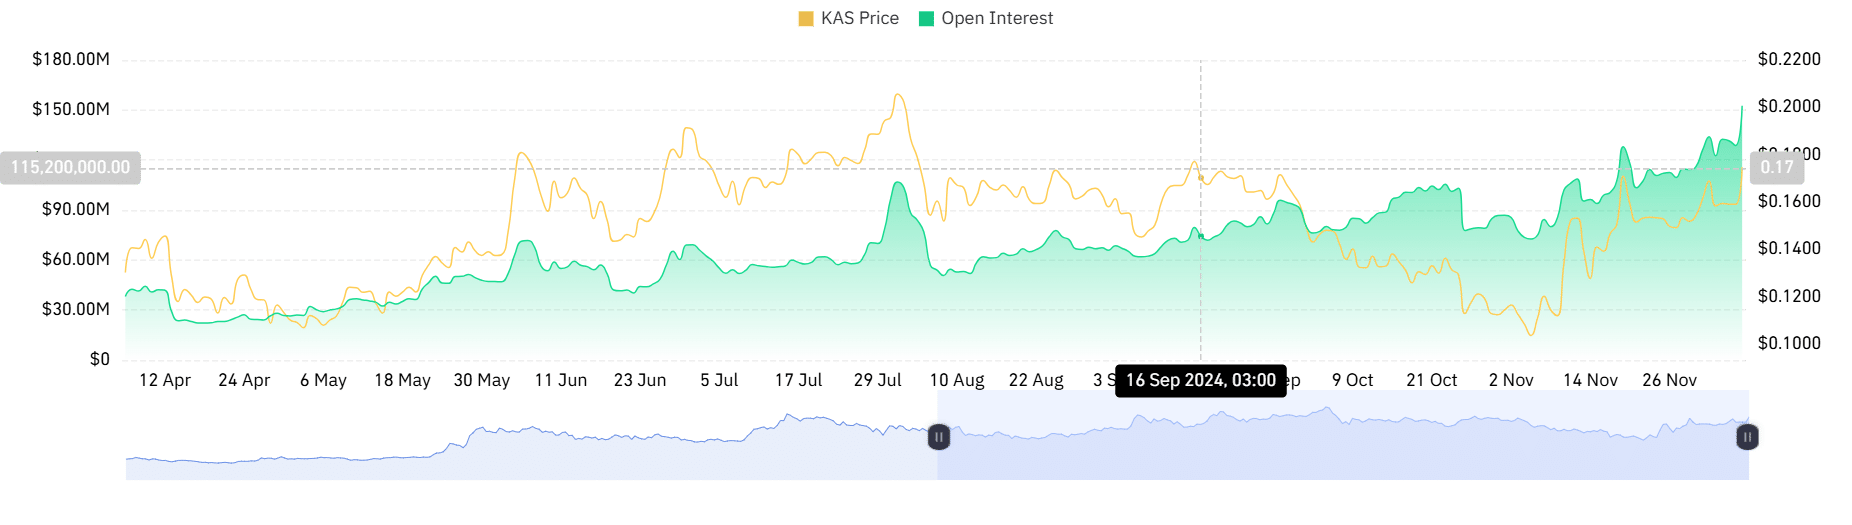
- Kaspa’s Open Interest surged to hit an all-time high on the charts
- On the price front, KAS hiked by 44.03% in the last 30 days alone
Since hitting a low of $0.101 a month ago, Kaspa [KAS] has recorded a strong uptrend to hit a high of $0.179 on the charts.
This upward momentum has persisted over the last 24 hours. In fact, at the time of writing, Kaspa was trading at $0.171. This marked a 10.7% hike over the course of just 24 hours. Equally, the altcoin gained on the weekly and monthly charts too, appreciating by 4.69% and 44.03%, respectively.
And yet, KAS remains approximately 17.48% below its ATH of $0.2075.
With Kaspa finally finding some momentum on the charts, the question – Is Kaspa now on the verge of a sustained uptrend?
What does altcoin’s chart suggest?
According to AMBCrypto’s analysis, Kaspa, at press time, was at the end of a strong uptrend, one accompanied by bullish sentiment among investors.
For starters, we can see this upward momentum with a bullish crossover on the MACD. In the last 24 hours alone, the MACD line crossed over the Signal line, indicating the potential for bullish trend continuation.
Source: Tradingview
Equally, the Stochastic RSI made a bullish crossover a day ago, suggesting that buyers are now in control of the market.
A higher buying pressure usually results in low supply amidst rising demand, thus pushing the price up the charts.