- Ethereum’s price resilience and key resistance levels suggest potential for an imminent breakout.
- Strong outflows, positive MACD, and dominant long positions indicate a supportive bullish setup.
Ethereum [ETH] has once again captured attention as it records a substantial daily net outflow exceeding 25 million, leading all other blockchains in capital movement. Such a large-scale shift could signal profit-taking or strategic repositioning by major investors.
With ETH trading at $2,618.54, up by 3.32% at press time, this trend raises the question: could these outflows consolidate liquidity and fuel a new bullish surge? Let’s break down the technicals and market indicators behind Ethereum’s current price dynamics.
ETH price analysis: Building up to a breakout?
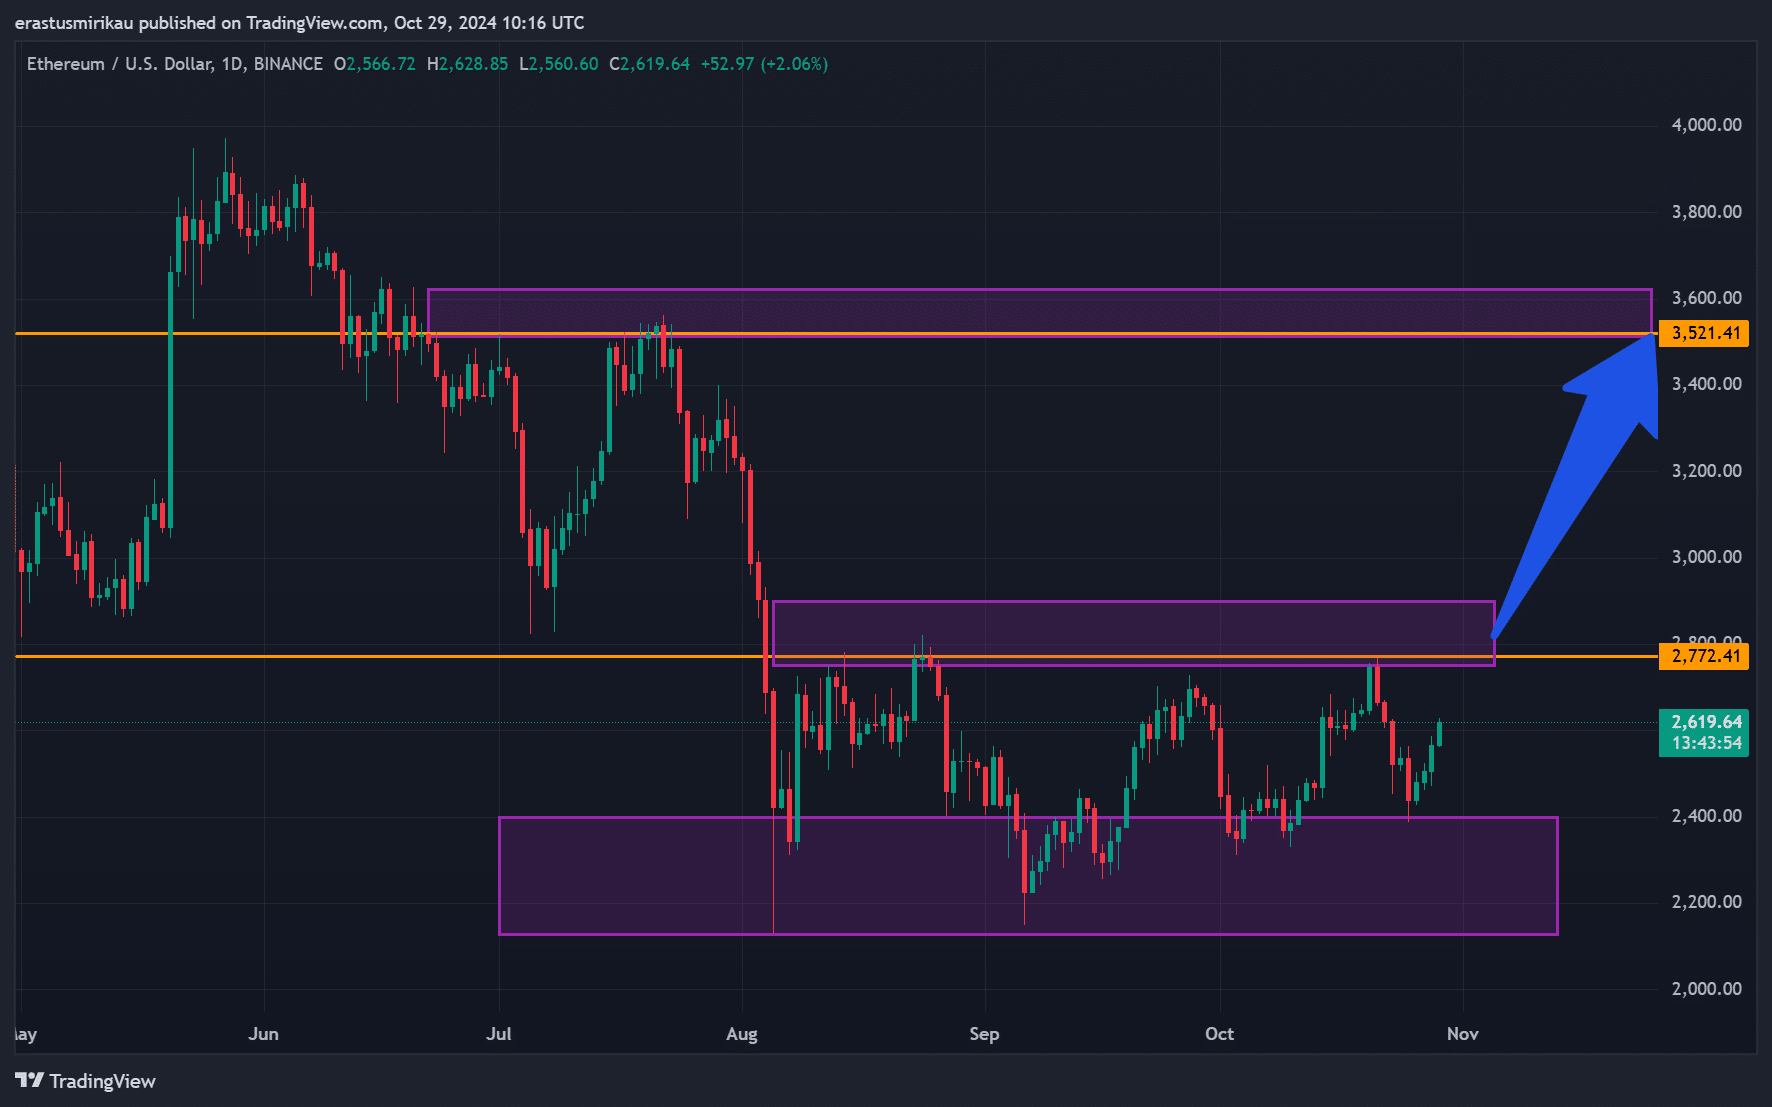
Ethereum’s recent price movements suggest that a breakout might be in the works. ETH has maintained strength above $2,500, a key psychological support, despite market fluctuations.
This level has proven resilient and may act as a launchpad for a stronger upward push.
Looking ahead, $2,772 stands as the immediate resistance level, while $3,521.41 represents a more significant barrier that could either confirm or halt bullish momentum.
If Ethereum successfully clears these levels, we could witness a sharp rally. However, if resistance holds firm, ETH might enter a consolidation phase, awaiting a decisive catalyst.
Source: TradingView
MACD and RSI indicate strengthening momentum
Ethereum’s technical indicators further emphasize its potential for an upward move. The Moving Average Convergence Divergence (MACD) indicator is showing bullish signs, as the MACD line has crossed above the signal line, often seen as a precursor to positive price action.
Additionally, the Relative Strength Index (RSI) is currently around 54.33, a
Go to Source to See Full Article
Author: Erastus Chami