
The Bitcoin (BTC) price has endured a roller-coaster week that began with a sharp decrease but has been followed by a bounce.
It remains to be seen if BTC will close its ninth successive bullish candlestick or if the positive trend will break.
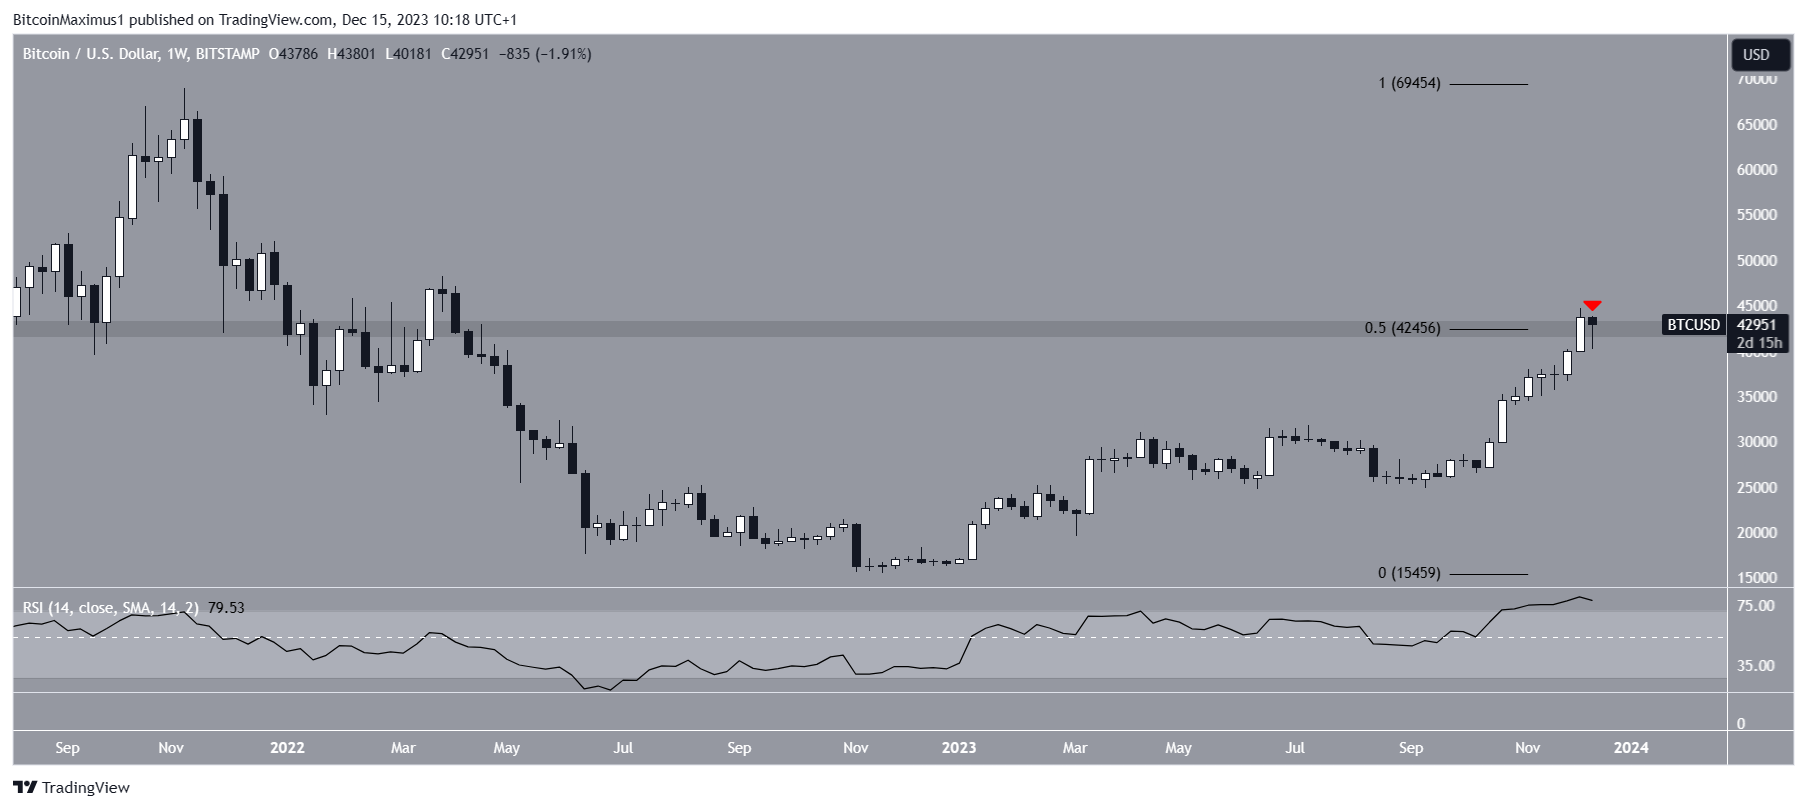
Can Bitcoin Close Above Long-Term Resistance?
The technical analysis from the weekly time frame shows that the BTC price has increased swiftly since October. During the increase, the price created eight successive bullish weekly candlesticks. This led to a new yearly high of $44,700 last week.
The Bitcoin price high was made above a pivotal Fibonacci and horizontal resistance level.
While Bitcoin started to fall this week, it has regained its footing and nearly negated all of its losses. So, it remains to be seen if this week’s candlestick will be bullish or bearish (red icon).
Go to Source to See Full Article
Author: Valdrin Tahiri
Tip BTC Newswire with Cryptocurrency
Donate Bitcoin to BTC Newswire

Donate Bitcoin Cash to BTC Newswire

Donate Ethereum to BTC Newswire

Donate Litecoin to BTC Newswire

Donate Monero to BTC Newswire

Donate ZCash to BTC Newswire


