Disclaimer: The information presented does not constitute financial, investment, trading, or other types of advice and is solely the writer’s opinion.
- Solana has a bullish structure on the higher timeframe price charts.
- The $40-$50 zone could be pivotal in the coming weeks.
Solana [SOL] was in the midst of a bullish run of a magnitude not witnessed since April 2022. However, the run back then was followed by a continuation of the previous downtrend. Was the same scenario set to repeat itself?
Is your portfolio green? Check out the SOL Profit Calculator
News of FTX unstaking an additional 1.6 million SOL meant bullish sentiment could take a hit and lead to a large price correction. It was unclear if traders and investors could expect such a drop, as Bitcoin [BTC] managed to stay above the $33k level and could go further up.
Where would an ideal retracement take SOL prices?
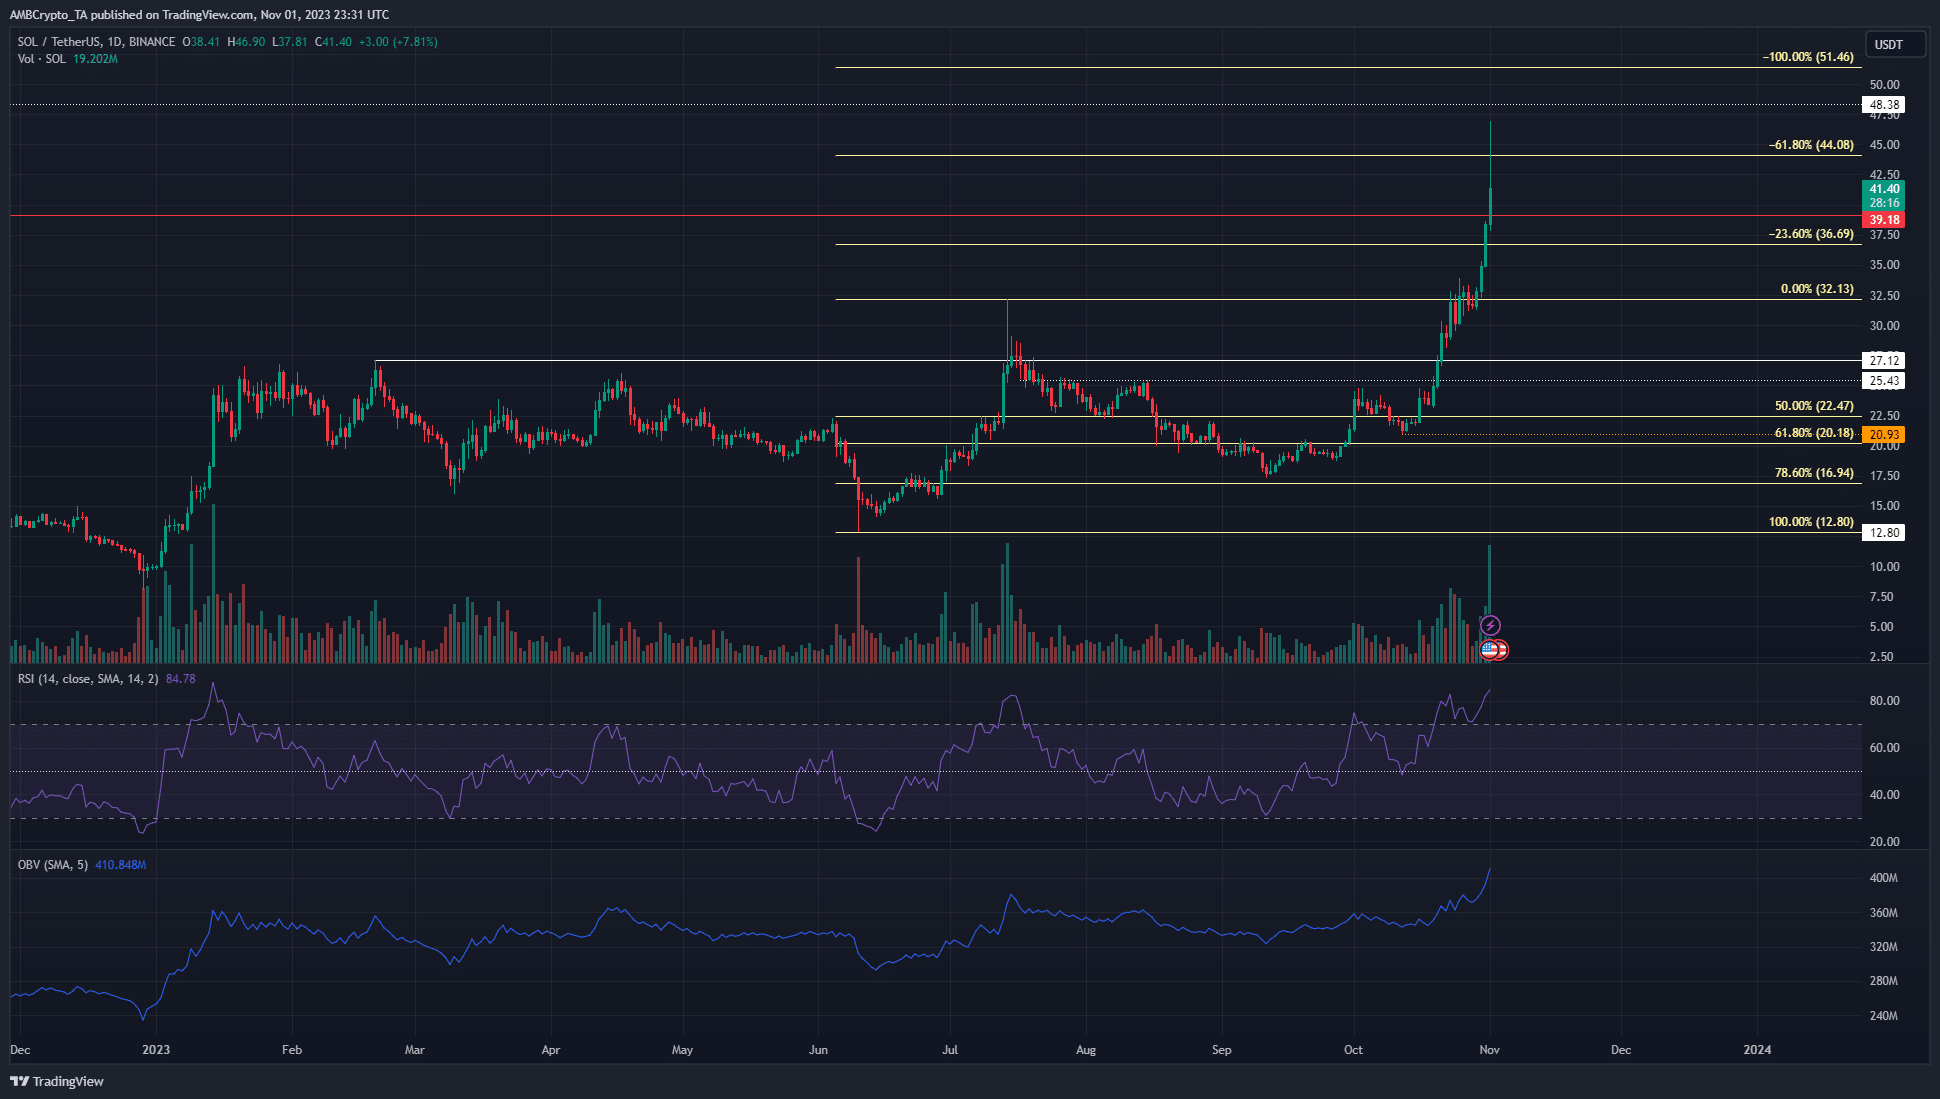
The one-day chart showed that bullish intent remained overwhelming. The RSI continued to move in the overbought territory above 70 and the On-Balance Volume was climbing higher. Together they showed buying volume was on the rise and the upward momentum was firm.
The higher timeframe charts showed that the move above $27-$30 was a definitive signal that further gains could follow. They did, and SOL reached $46.9 on 1 November. A revisit to the former range highs at $27 would be an ideal long-term buying opportunity.
The Fibonacci extension levels showed $44.08 and $51.46 were levels where bulls could book profits and wait for a retracement.
The conviction of buyers in the market mea
Go to Source to See Full Article
Author: Akashnath S
Did you like this?
Tip BTC Newswire with Cryptocurrency
Donate Bitcoin to BTC Newswire
 Scan the QR code or copy the address below into your wallet to send some bitcoin:
Donate Bitcoin Cash to BTC Newswire
Scan the QR code or copy the address below into your wallet to send bitcoin:
Donate Ethereum to BTC Newswire
Scan the QR code or copy the address below into your wallet to send some Ether:
Donate Litecoin to BTC Newswire
Scan the QR code or copy the address below into your wallet to send some Litecoin:
Donate Monero to BTC Newswire
Scan the QR code or copy the address below into your wallet to send some Monero:
Donate ZCash to BTC Newswire
Scan the QR code or copy the address below into your wallet to send some ZCash:
Tip BTC Newswire with Cryptocurrency
Donate Bitcoin to BTC Newswire

Donate Bitcoin Cash to BTC Newswire

Donate Ethereum to BTC Newswire

Donate Litecoin to BTC Newswire

Donate Monero to BTC Newswire

Donate ZCash to BTC Newswire


