Disclaimer: The information presented does not constitute financial, investment, trading, or other types of advice and is solely the writer’s opinion.
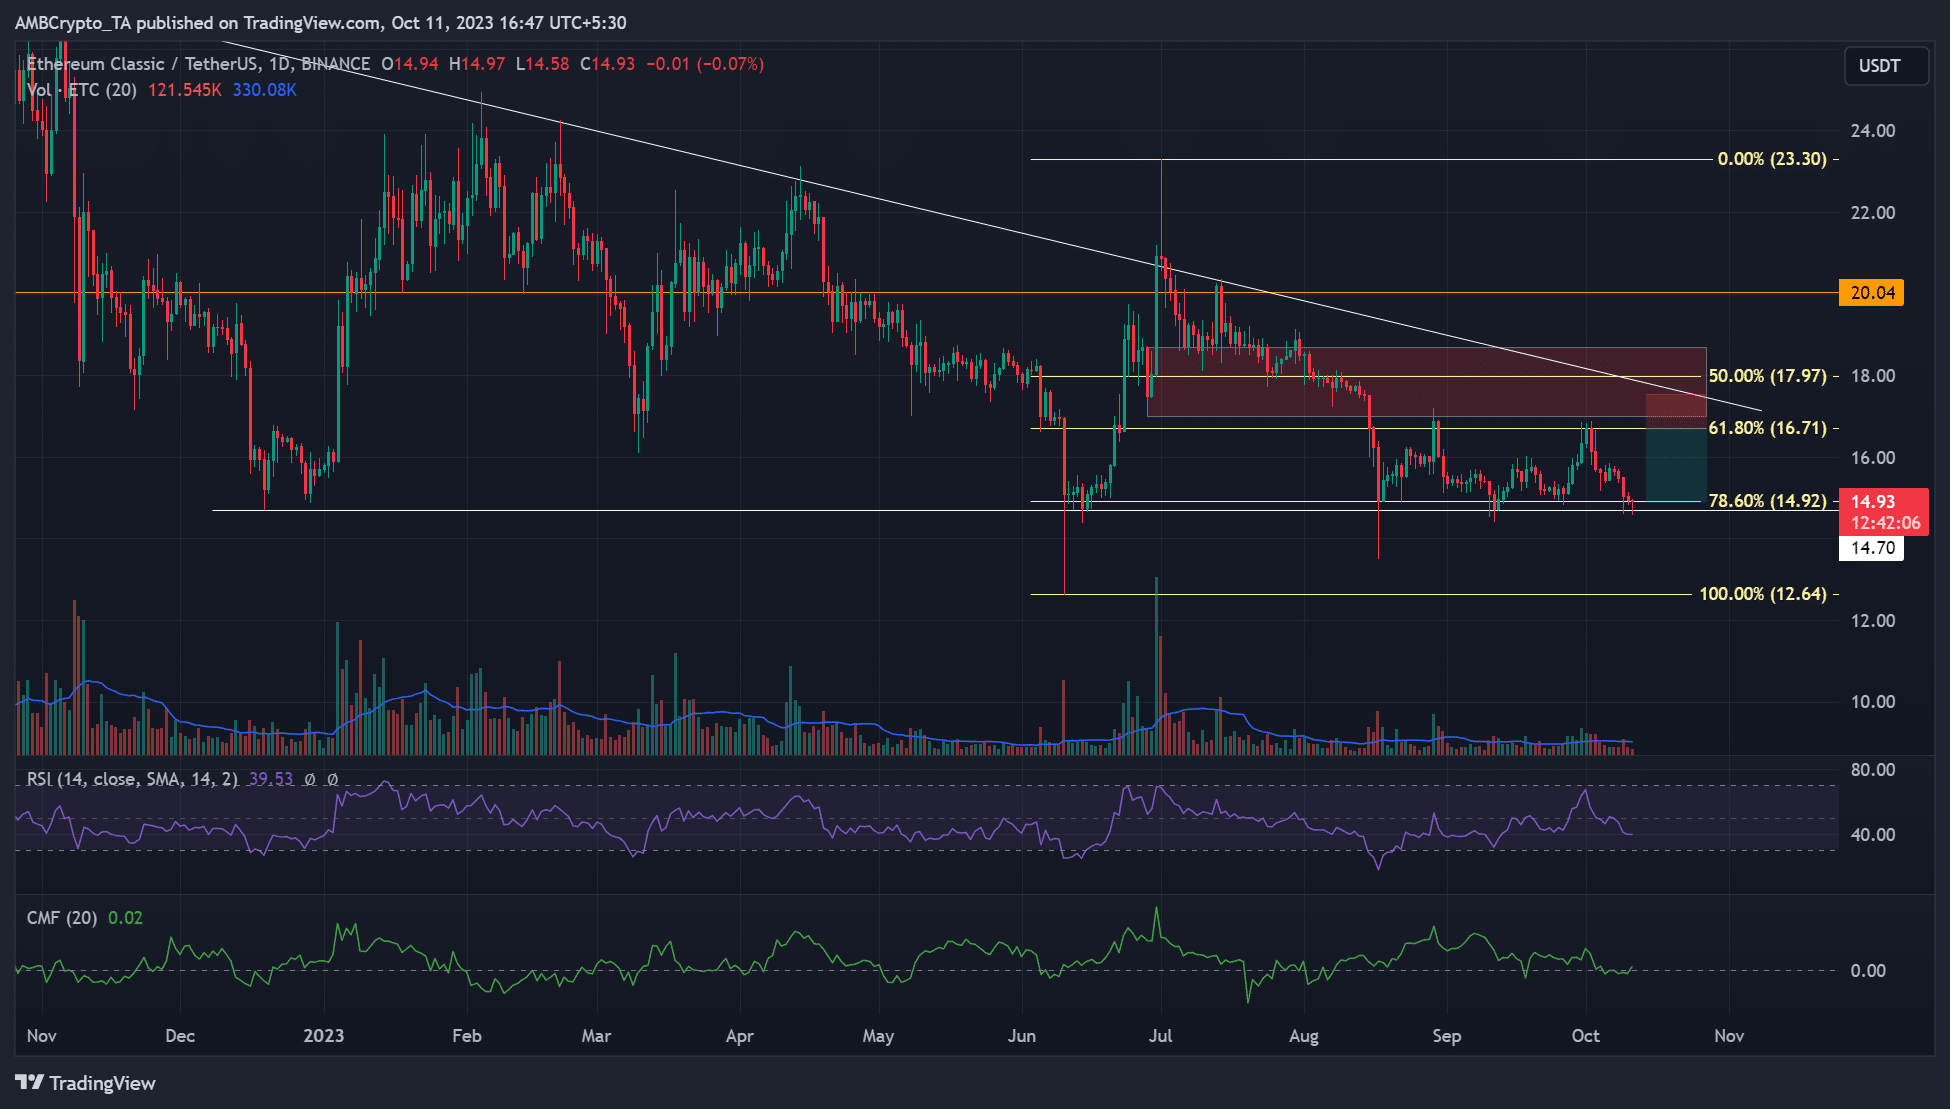
- ETC chalked a descending triangle pattern – a bearish formation.
- The confluence of a hurdle and the 50% Fib level could derail a price surge beyond $18.
Ethereum Classic [ETC] fluctuated between $14 and $16 in the past few weeks. ETC sellers pushed the altcoin to a bearish target and multi-month support of $14.7. The move translated to +10% shorting gains when traced from a previous lower high of $16.89.
Is your portfolio green? Check out the ETC Profit Calculator
AMBCryto’s price analysis of ETC on 6 October evaluated how bears quickly overwhelmed bullish momentum at the $16 level. The bearish takeover saw ETC extend its decline to $14.7 support with no solid bullish intervention at press time.
Will sellers double down?
The Relative Strength Index (RSI) was negative and highlighted selling pressure intensified. However, the capital inflows wavered, as illustrated by the stagnated Chaikin Money Flow (CMF) at zero.
Despite the bearish pressure at the time of writing, ETC retraced to a key $14.7 support that has stopped extra price drops since December 2022.
An attempted bullish reversal could be derailed at the overhead confluence of the trendline resistance and the 50% Fib level (near $17) or $16.
Such a scenario could provide two possible short set-ups. Aggressive players could seek re-ent
Go to Source to See Full Article
Author: Benjamin Njiri
Tip BTC Newswire with Cryptocurrency
Donate Bitcoin to BTC Newswire

Donate Bitcoin Cash to BTC Newswire

Donate Ethereum to BTC Newswire

Donate Litecoin to BTC Newswire

Donate Monero to BTC Newswire

Donate ZCash to BTC Newswire


