
Solana (SOL) is among the top-performing cryptocurrencies in the market. It has recorded a price increase of over 500% year-to-date, climbing from $9.9 to $68.4.
Despite these substantial gains, SOL could be poised for a brief correction before the uptrend resumes.
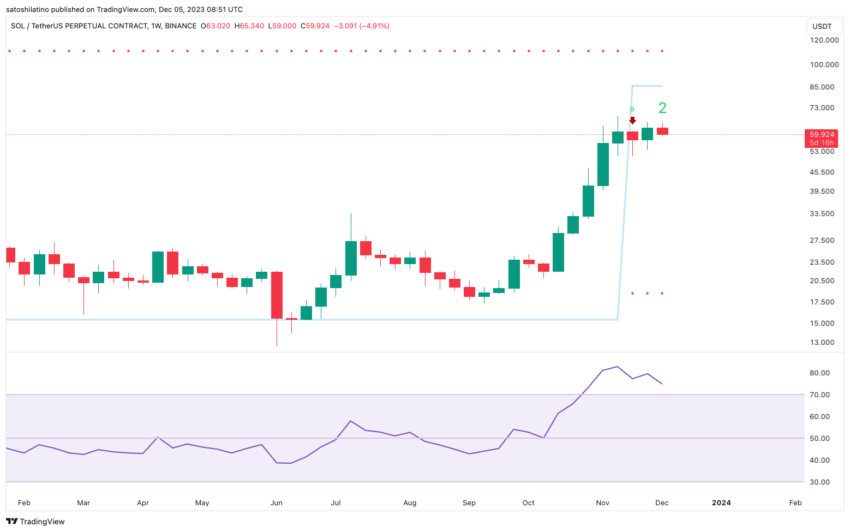
SOL Price Shows Signs of Exhaustion
The Tom DeMark Sequential Indicator, commonly called the TD Sequential, suggests that SOL may have reached a local peak. It has presented a green nine candlestick on Solana’s weekly chart, a bearish formation.
This sell signal aligns with the Relative Strength Index (RSI) hovering with the overbought territory. The RSI stands at 75 on Solana’s weekly chart, indicating a potential trend reversal or corrective price pullback.
If these bearish signs materialize, Solana could see a spike in profit-taking, triggering a correction that may last one to four weekly candlesticks.
The TD Sequential is a technical analysis tool designed to identify potential buying and selling opportunities by predicting trend exhaustion points. It is based on a seri
Go to Source to See Full Article
Author: Ali M.
Tip BTC Newswire with Cryptocurrency
Donate Bitcoin to BTC Newswire

Donate Bitcoin Cash to BTC Newswire

Donate Ethereum to BTC Newswire

Donate Litecoin to BTC Newswire

Donate Monero to BTC Newswire

Donate ZCash to BTC Newswire


